Figure 3.
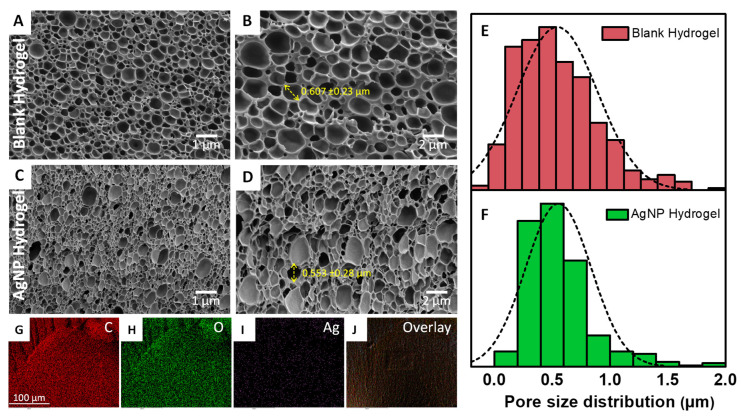
(A–D) SEM micrographs of both blank and AgNP hydrogel at two different magnification 10K X (left panel) and 20K X (right panel). The yellow arrow shows the representative pore size. (E,F) Hydrogel size distribution of both blank and AgNP-loaded hydrogel. (G–J) EDS elemental mapping of carbon (C), oxygen (O), silver (Ag), and overlay images.

