Figure 3.
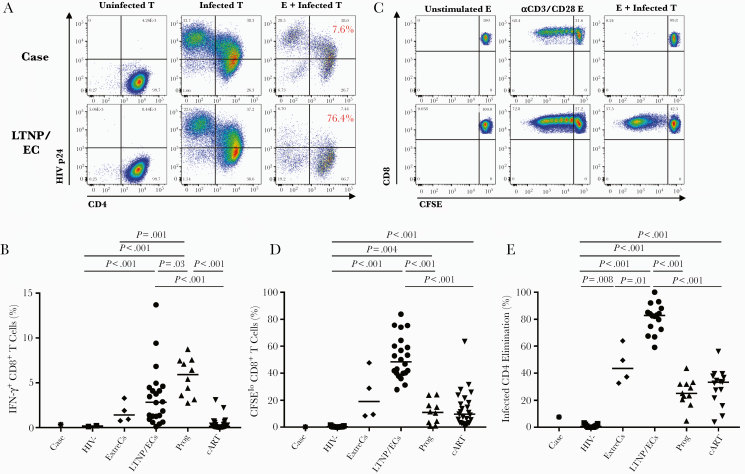
The case’s CD8+ T-cell responses to human immunodeficiency virus (HIV)-infected targets differed from those of spontaneous HIV controllers. (A) Flow plots gated on autologous CD4+ T-cell targets (T) from the case (top row) and a conventional long-term nonprogressors/elite controller ([LTNP/EC] bottom row) depict high-level HIVSF162 infection (middle column) in contrast to non-superinfected CD4+ T cells (left column). Cytotoxic responses, measured by percentage elimination of infected CD4+ T-cell targets by day 6 CD8+ T-cell effectors (E), are shown on representative plots as red values (right column). (B) Summary data of interferon-γ + CD8+ T-cell responses after 6-hour stimulation with autologous infected targets are shown for the case (asterisk), uninfected controls (squares), extreme controllers ([ExtreCs] diamonds), LTNP/ECs (circles), viremic progressors (upturning triangles), and combination antiretroviral therapy-suppressed progressors (downturning triangles). Background responses to uninfected targets have been subtracted. (C) Flow plots show CD8+ T-cell proliferation to HIV-infected targets (right column) along with medium (left column) and anti-CD3/anti-CD28-stimulated (middle column) controls of the case (top row) and representative LTNP/EC (bottom row). (D and E) Summary data of CD8+ T-cell proliferation (D) and cytotoxic capacity (E) are depicted for the case (asterisk) and other groups as shown in (B). Background cytotoxic responses to uninfected targets have been subtracted. Horizontal lines represent median values. Only significant P values referring to comparisons among uninfected controls and chronically infected patients are shown. CFSE, 5,6-carboxyfluorescein diacetate, succinimidyl ester.

