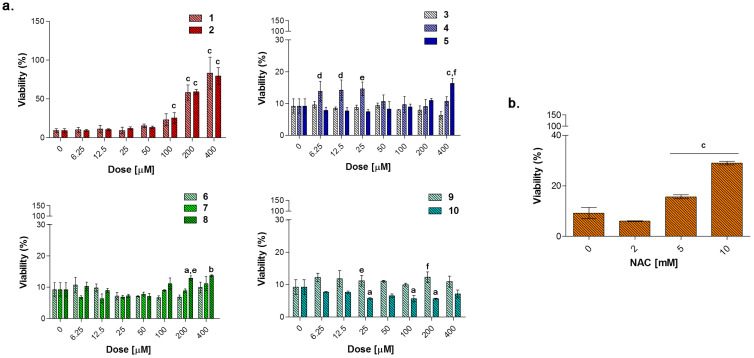
Figure 10.
Cell metabolic activity of LPS-stimulated (0.1 μg/mL) RAW 264.7 mouse macrophages in the presence of increasing concentrations (0–400 μM) of compounds 1–10 (a) and NAC (N-acetyl cysteine) (0–10 mM) (b) after 48 h. Data shown are the means ± S.D. of six replicates and are expressed as percentages of untreated cultures set as 100% (not shown). The 0 μM concentration represents cells stimulated with 0.1 μg/mL alone. (a = p < 0.05 between compounds or NAC and cells exposed to LPS alone; b = p < 0.01 between compounds or NAC and cells exposed to LPS alone; c = p < 0.001 between compounds or NAC and cells exposed to LPS alone; d = p < 0.05 between compounds at the same concentration; e = p < 0.01 between compounds at the same concentration; f = p < 0.001 between compounds at the same concentration).

