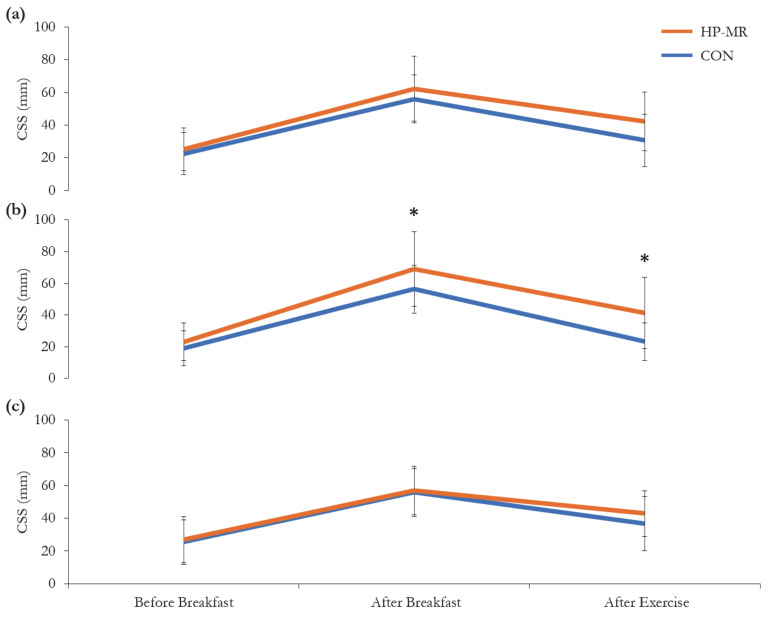
Figure 5.
Composite satiety score during the HP-MR and CON interventions in (a) all participants (n = 43), (b) females (n = 19), and (c) males (n = 24). Data are mean ± standard deviation. * Significant difference (p < 0.03) between the HP-MR and CON diets, as assessed by a mixed analysis of variance. Abbreviations: CON: control, standard North American diet; CSS: composite satiety score; HP-MR: high-protein meal replacement.

