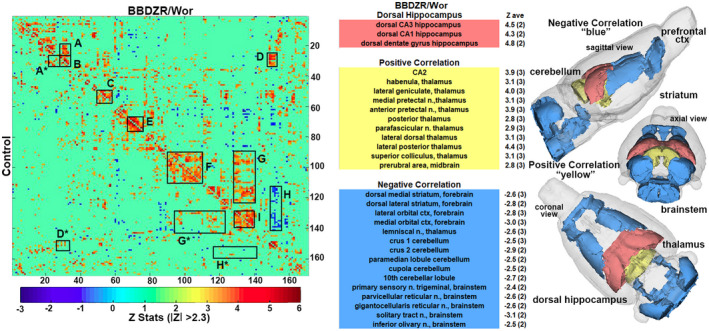
FIGURE 3.

Resting‐sate functional connectivity. To the left is a correlation data matrix comparing control and BBZDR/Wor rats. To the right are tables of positively (yellow) and negatively (blue) coupled areas to the dorsal hippocampus (red) with 3D reconstruction summarizing the brain areas. A, intra‐thalamic connections; B, posterior thalamus; C, midbrain, D connections between the habenula/tectal/parafascicular thalamus and the dorsal hippocampus; E, prefrontal cortex; F, cerebellum/pons; G, connections between the cerebellum/pons and the trigeminal brainstem reticular activating system; H, hippocampus and the posterior cerebellum; and I is the brainstem reticular activating system and deep cerebellar nuclei
