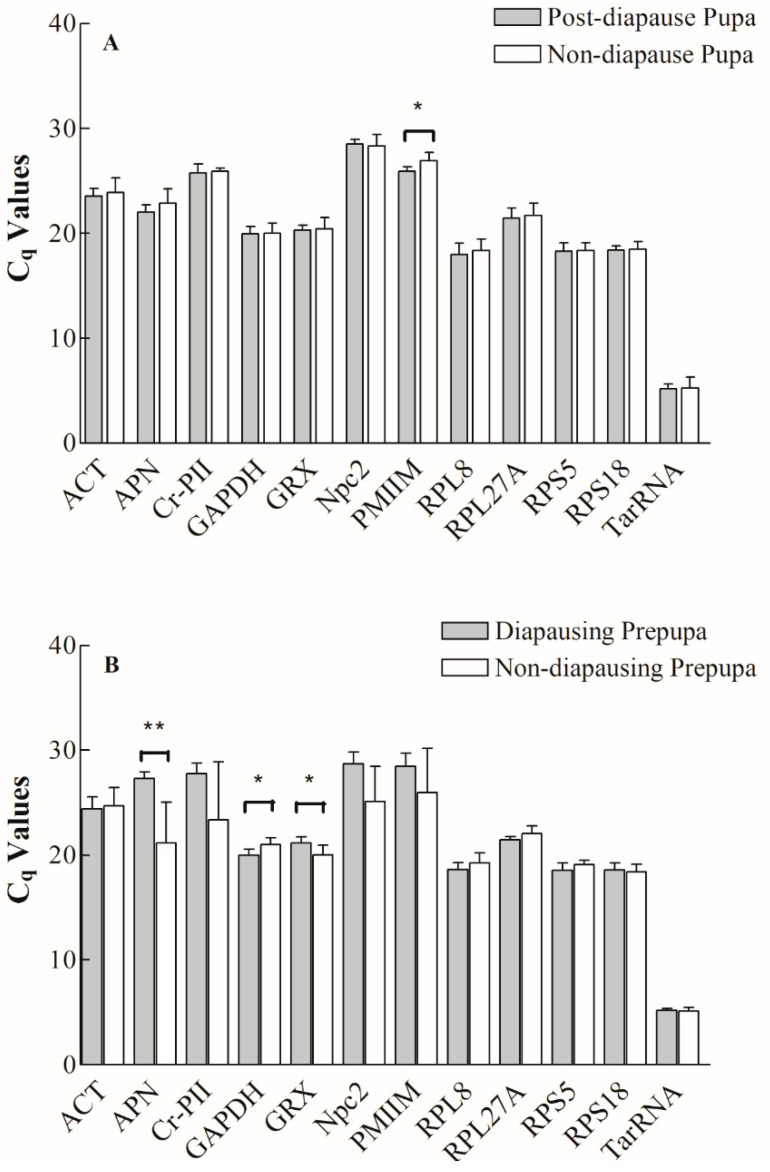
Figure 3.
Comparison of twelve candidate reference gene transcripts of Megachile rotundata expressed as Cq values between post-diapause pupa vs. pupa from non-diapausing prepupa (A), and between diapausing prepupa vs. non-diapausing prepupa (B). Cq values are normalized Ct values. Treatments that are significantly different between diapausing and non-diapausing samples according to Student’s t-tests are labeled with asterisks (* p ≤ 0.05; ** p ≤ 0.01; n = 5). Error bars represent the standard deviation of the mean (SD).

