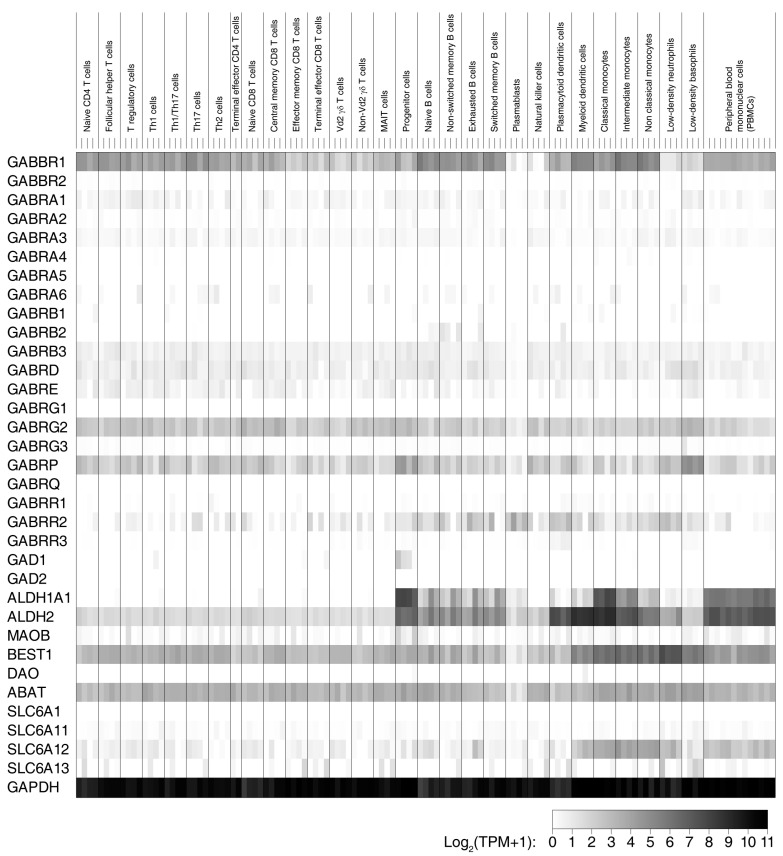
Figure 4.
Heat map representation of the expression of genes related to the GABA system in 29 different human immune cell types as determined by single-cell RNA-Seq. The transcript expression profiles in 29 human immune cell types isolated from four individuals as well as in the peripheral blood mononuclear cells (PBMCs) from 13 individuals were obtained by Monaco et al. [58]. The relative levels of transcripts encoding GABAB-R subunits (GABBR1 and GABBR2), GABAA-R subunits (GABRA1–6, GABRB1–3, GABRD, GABRE, GABRG1–3, GABRP, and GABRR1–3), GABA synthetic enzymes GAD67 and GAD65 (GAD1 and GAD2, respectively), GABA synthesis and secretion via the putrescine pathway (ALDH1A1, MAOB, BEST1, or DAO), GABA degradation (ABAT), GABA transporters (SLC6A1, SLC6A11, SLC6A12, and SLC6A13), and the “housekeeping” gene glyceraldehyde 3-phosphate dehydrogenase (GAPDH) are shown. Transcript expression values in transcripts per million (TPM) for these genes were taken from Monaco et al. [58], log2 transformed with a pseudocount of 1 and plotted as a heat map. The raw numerical data are shown in Supplemental Table S1.

