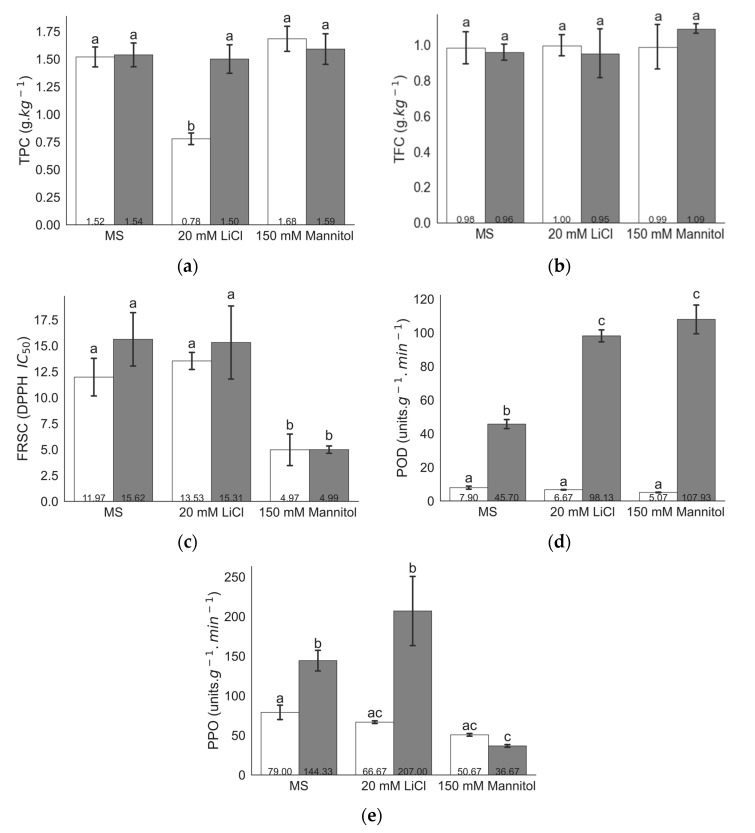
Figure 1.
Biochemical analysis of cultivars BARI-401 (white) and Spunta (grey) grown on MS with addition of 20 mM LiCl or 150 mM mannitol. (a) Total phenols content (TPC), (b) total flavonoid content (TFC), (c) free radical scavenging capacity (FRSC DPPH IC50 value), (d) polyphenol oxidase (PPO), and (e) peroxidase (POD) activity. Values are means ± standard deviation (SD) (n = 3) with letters indicating significant differences between cultivars and treatments, determined by two-way analysis of variance (ANOVA) and Tukey-Kramer HSD (p ≤ 0.05).

