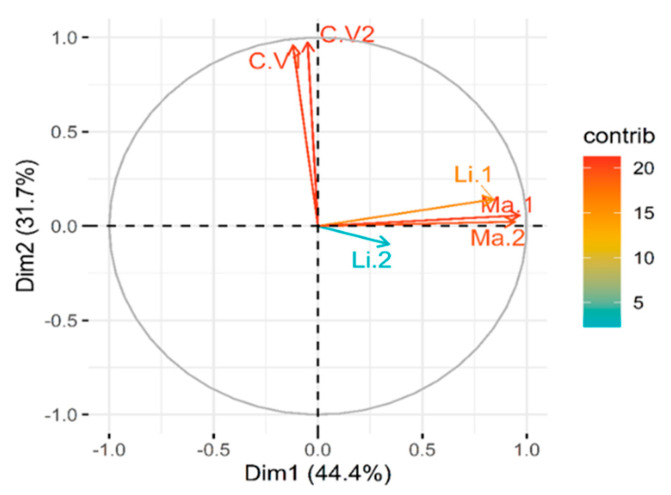
Figure 5.
Principal component analysis (PCA) for C.V1 (Control BARI-401), C.V2 (Control Spunta), Li.1,2 (LiCl 20 mM BARI-401 and Spunta) and Ma.1,2 (Mannitol 150 mM BARI-401 and Spunta). The circle has a correlation value of 1.0, and arrow lengths are proportional to the correlation coefficient for each variable.

