
Figure 1.
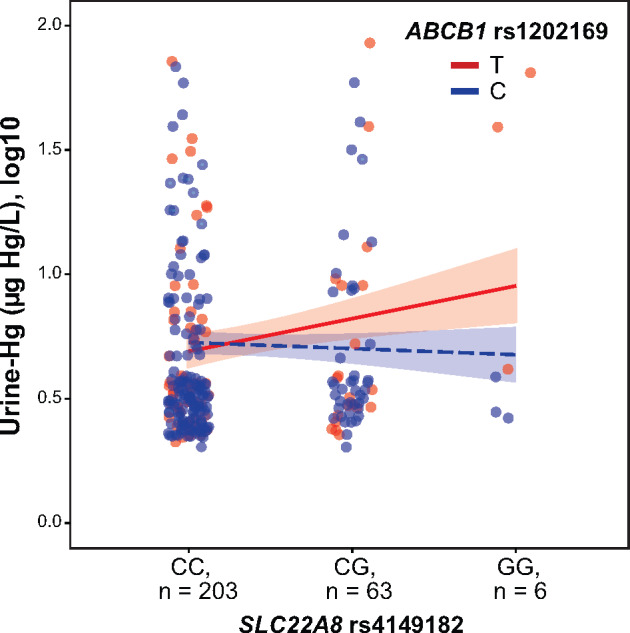
Interaction effects of genetic variants in a multivariable model of urine-Hg. The urine-Hg concentration was defined as a function of interaction between SLC22A8 rs4149182 under an additive model and ABCB1 rs1202169 under a dominant model in the total sample. The interaction plot shows a significantly increasing trend of urine-Hg levels when individuals carry both rs4149182-G and rs1202169-T alleles (β = −0.15, p = .047, and pperm = .025). A simple slope analysis showed that the association between urine-Hg and SLC22A8 rs4149182 was stronger in individuals with rs1202169-T allele (β = 0.13, p = .04, and pperm = .021) compared with individuals with rs1202169-C allele (β = −0.02, p = .60, and pperm = .89). All interaction analyses were adjusted by exposure status, age, sex, estimated glomerular filtration rate, and hair-Hg levels (µg Hg/g hair).