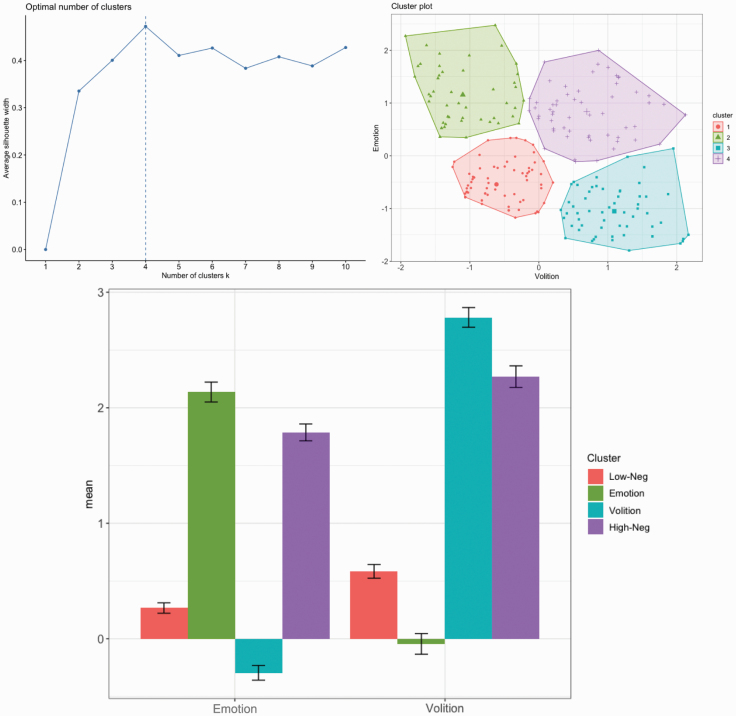
Fig. 1.
Negative symptom cluster membership in a clinical high-risk sample. The optimal number of clusters from a silhouette plot and cluster membership from k-means clustering are depicted. Axes represent mean residualized factor scores. The four cluster groups include participants with low negative symptom severity (Low-Neg), impaired emotion but intact volition (Emotion), higher severity scores in volition but intact emotion (Volition), and high negative symptom severity (High-Neg). Error bars represent standard error.

