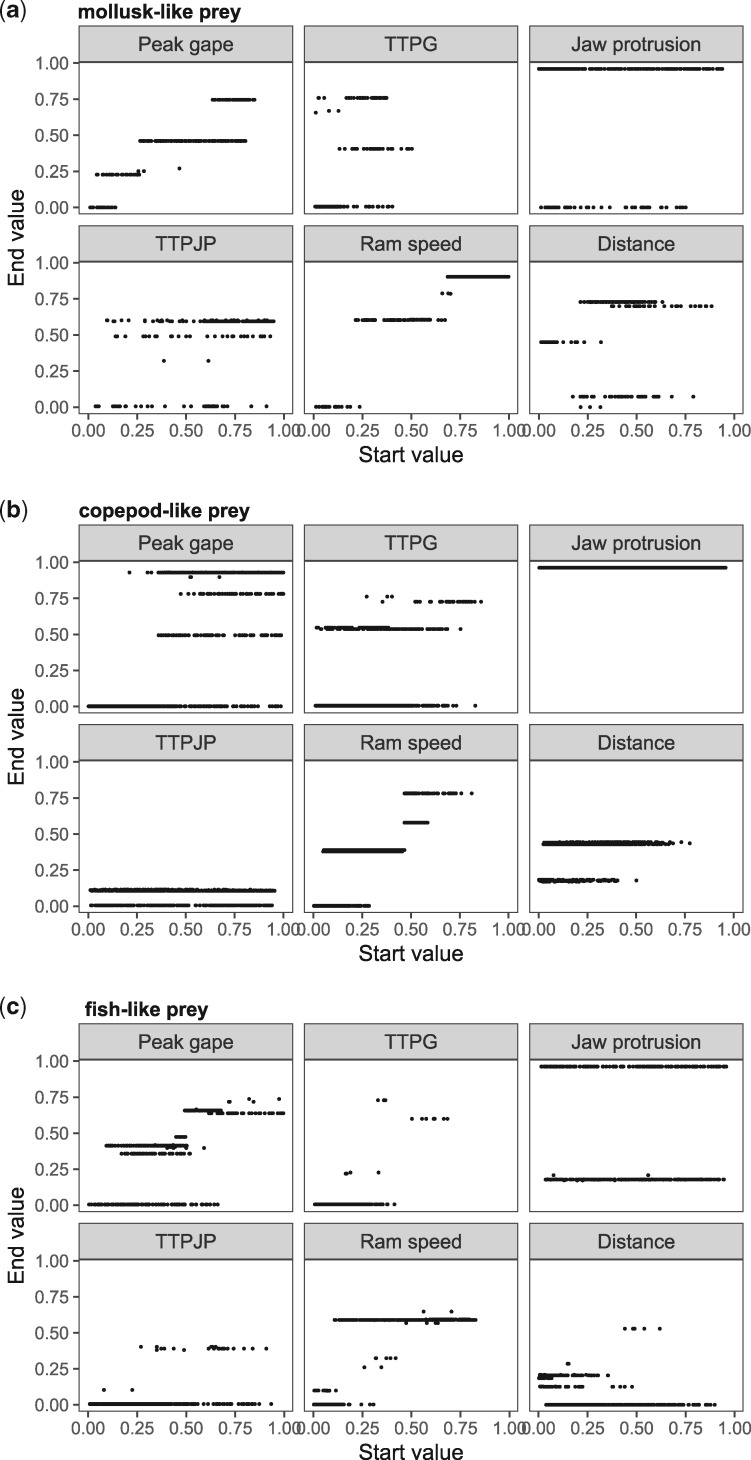
Fig. 3.
Gradient ascent analysis for the performance landscape for suction feeding on (a) mollusk-like prey, (b) copepod-like prey, and (c) fish-like prey with the parameters scaled to the [0,1]-interval. Start and end points for the six variables that describe the landscapes are plotted on the x- and the y-axes, respectively. As described in Fig. 1, the number of local peaks is reflected in the number of horizontal lines. Note that the three prey types here are not “real” prey but refer to prey which respond to an approaching predator in a way typical for mollusks, copepods, and fish (i.e., clinging to a holdfast, attempting escape hydrodynamic strain is detected, or attempting escape when a predator is within a certain distance).

