
Fig. 5.
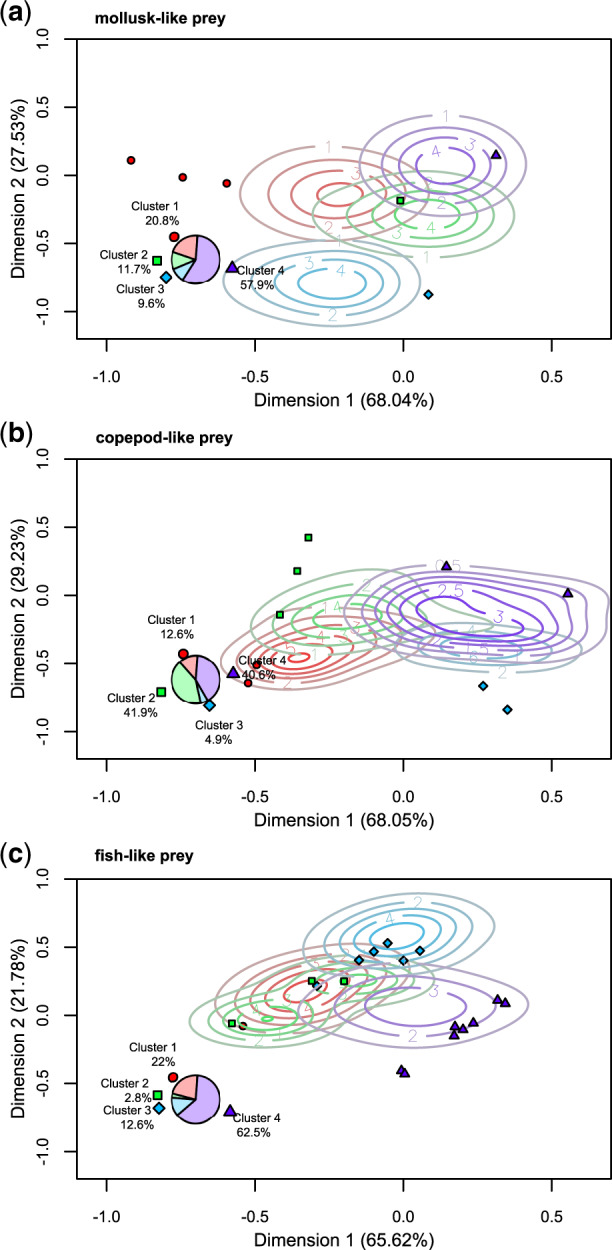
Different peaks have different “basins of attraction.” Kernel density estimate contours of the location of the start points associated with each peak cluster (as identified by color and point shape), projected onto the first two dimensions of the PCA performed on the local peaks. The local peaks defining the clusters are denoted by solid points in the associated color and shape, and the fraction of points belonging to each cluster is shown in the inset pie chart. Top panel shows the clusters of the landscape for mollusk-like prey, middle panel the landscape for copepod-like prey, and lower panel the landscape for fish-like prey. The full color version is available in the electronic version, but is not necessary for interpretation of the figures.