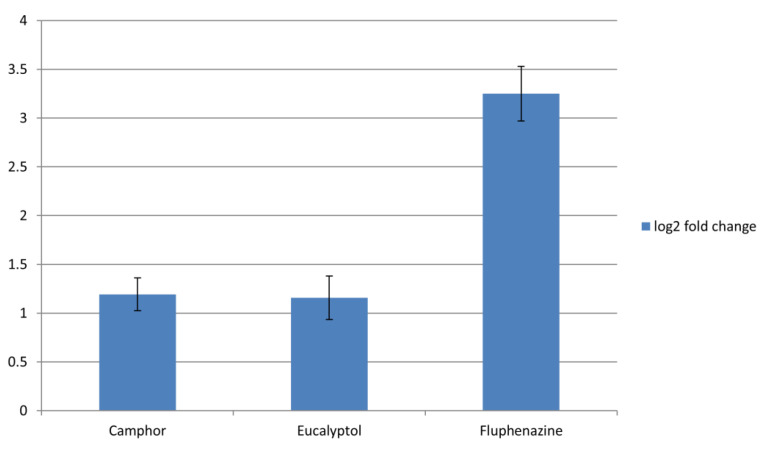
Figure 5.
Expression levels of CDR1 after treatment with MIC of camphor and eucalyptol; fluphenazine was used as a positive control for CDR1 expression. Values are expressed as the log2 fold change (log2 FC) of Relative Quantification (RQ) values and presented as an average of two biological replicates.

