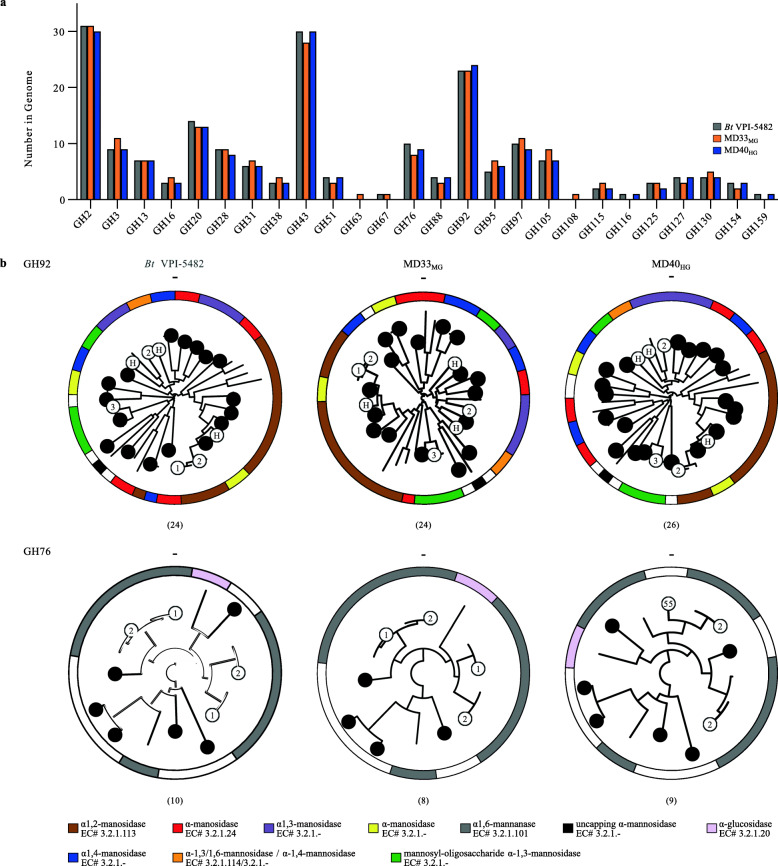
Fig. 4.
CAZyme fingerprinting of YM metabolism by BtBov isolates. a GH enzyme families encoded within the genomes of MD40HG and MD33MG that differ in total number of sequences. BtVPI-5482 sequences are provided as a reference for each GH family. b Phylogenetic trees of characterized GH92s and GH76s, and BtBov sequences generated with SACCHARIS [37]. Circles represent BtBov sequences and white circles highlight sequences from PULs with mannan activity: 1, 2, or 3 = MAN-PULs 1, 2, or 3, respectively; H = HMNG-PUL; 55 = BtMD40 PUL55. Activities assigned to characterized enzymes within each clade for GH92 and GH76 are depicted using the provided legend. Outer ring represents characterized specificities. Numbers in parenthesis indicate the total number of enzymes within each strain

