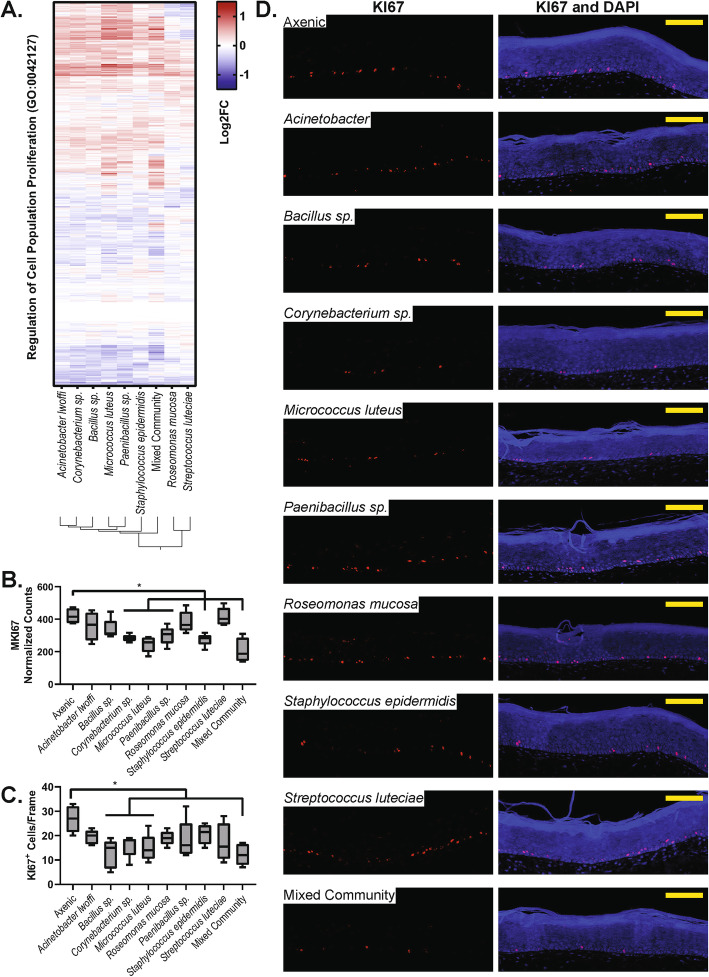
Fig. 5.
Microbiome treatment affects cell proliferation. a Heat map showing the expression of genes in the ‘Regulation of cell proliferation’ gene set. b Normalized counts of the MIK67 transcript in each treatment condition. c The number of KI67+ cells counted in each treatment condition, across five tissues. * indicates condition is different from the axenic control, one-way ANOVA followed by Dunnett’s multiple comparisons test against the axenic control, p < 0.05. d Representative immunofluorescence images of each treatment conditions showing DAPI-stained nuclei in blue and KI67 in red. All scale bars indicate 100 μm

