Figure 1.
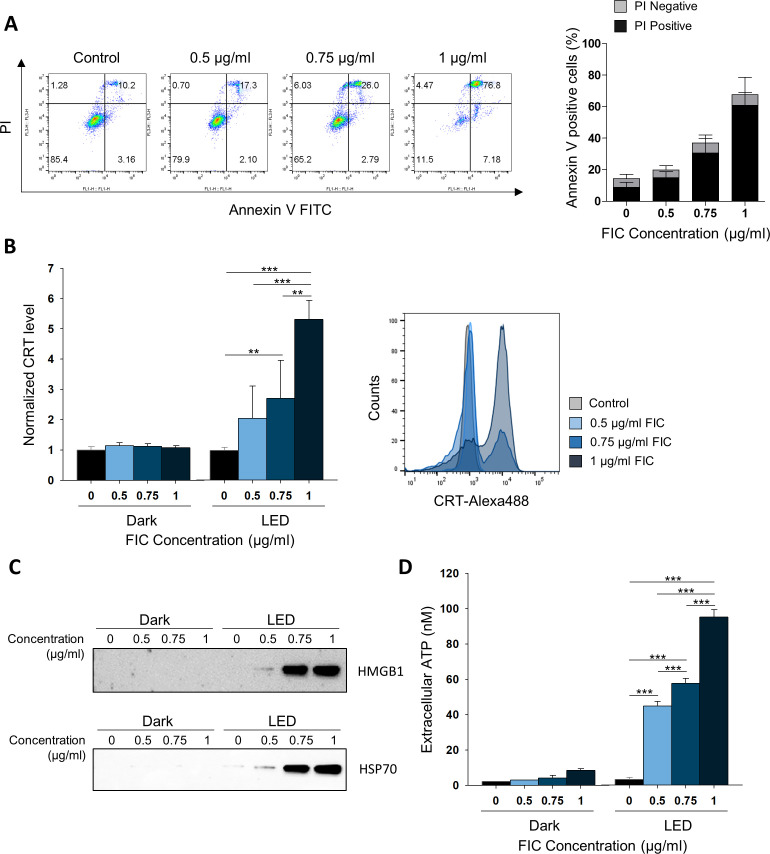
Analysis of cell death induction and detection of hallmarks of immunogenic cell death triggered by FIC-PDT in B16F10 cells. (A) Dying or dead B16F10 cells after FIC-PDT treatment with varying concentrations of FIC. The percentage represents early (PI-negative) and late (PI-positive) apoptosis. (B) Flow cytometric analyses of CRT expression on the surface of cell membrane-gated PI- intact cells. Data are presented as the relative mean fluorescence intensity. (C) Immunoblotting of HMGB1 and HSP70 released in conditioned media after FIC-PDT treatment or not. (D) Quantification of secreted ATP from FIC-PDT treated B16F10 cells. One-way ANOVA followed by Tukey’s posthoc test was used for statistical analysis; *p<0.05, **p<0.01, ***p<0.001. Data are presented as the mean±SD. ANOVA, analysis of variance; CRT, Calreticulin; FIC-PDT, PDT with Ce6-embedded nanophotosensitizer; PDT, photodynamic therapy; PI, propidium iodide.

