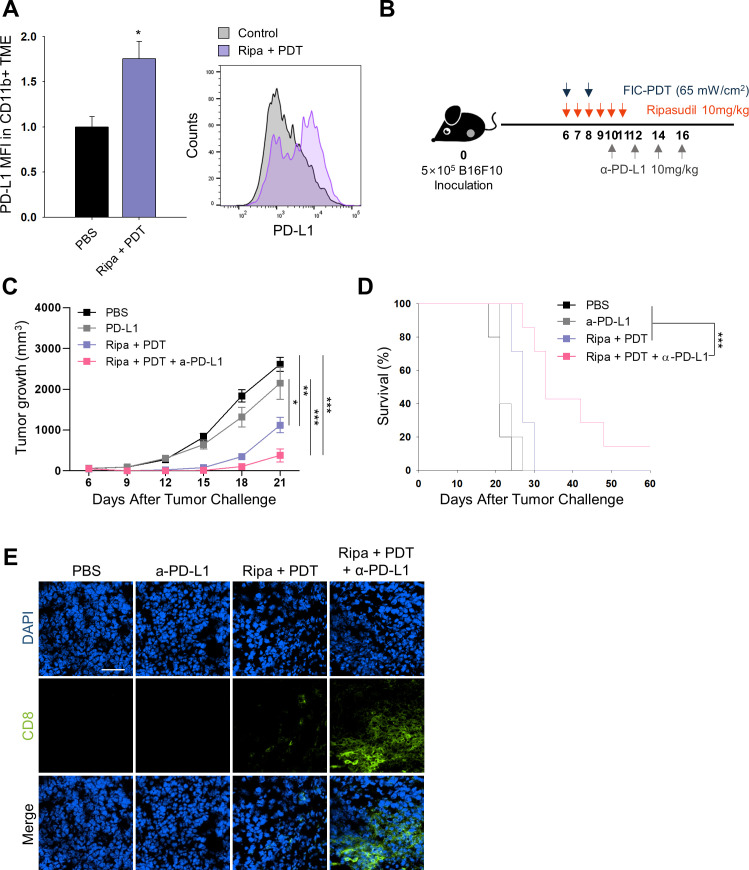
Figure 4.
In vivo PD-L1 expression and combined therapy with FIC-PDT, ripasudil, and anti-PD-L1 antibody. (A) PD-L1 expression of CD11b+ cells in TME assessed by flow cytometry (n=3 per group) (B) Treatment schedule of FIC-PDT, ripasudil and α-PD-L1 antibody. (C) Tumor growth curves (n=8–10 per group) and (D) survival curves (n=5–7 per group) in B16F10 tumor-bearing mice after various treatments. (E) Tumor-infiltrating CD8+ T cells in tumor under fluorescent microscope (n=4 per group). One-way ANOVA followed by Tukey’s posthoc test was used for statistical analysis; *p<0.05, **p<0.01, ***p<0.001. Data are presented as the mean±SEM. Survival was determined using the log‐rank test. ANOVA, analysis of variance; FIC-PDT, PDT with Ce6-embedded nanophotosensitizer; PDT, photodynamic therapy; TME, tumor microenvironment.

