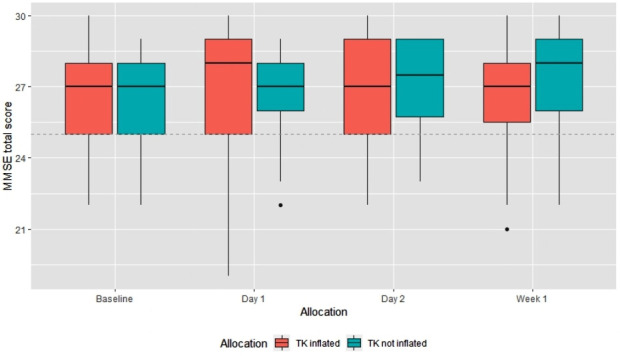
Figure 2.

Box plot of MMSE total score by allocation group and time point. *Each box represents the first and third quartiles of the data, black middle line represents median value. Whiskers cover the max or minimum value or 1.5 times the interquartile range (IQR). Values outside 1.5*IQR are plotted individually as dots. MMSE, Mini-Mental State Examination.
