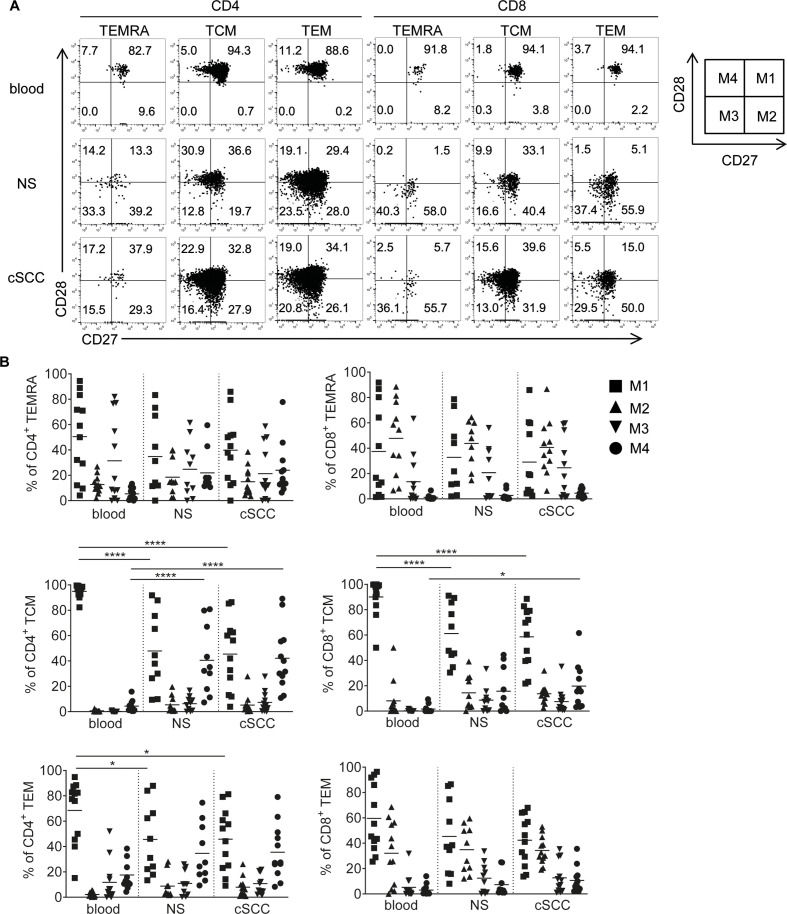
Figure 2.
Expression of CD27 and CD28 by different memory T-cell subsets. (A) Representative FACS plots from blood, normal skin (NS) and cSCC from the same patient showing expression of CD27 (X-axis) and CD28 (Y-axis) in TEMRAs, TCMs and TEMs within the CD4 and CD8 T-cell populations. A schematic diagram is shown on the right, defining the M1 (CD27+CD28+), M2 (CD27+CD28−), M3 (CD27−CD28−) and M4 (CD27−CD28+) populations as depicted (with M1, M2, M3, M4 also known as EM1, EM2, EM3 and EM4 in the TEM population). (B) Graphs showing percentages of CD4+ TEMRAs (upper left), CD4+ TCMs (middle left), CD4+ TEMs (lower left) and CD8+ TEMRAs (upper right), CD8+ TCMs (middle right), CD8+ TEMs (lower right) from blood, NS and cSCC (n=14 tumors) which are M1, M2, M3 and M4. Horizontal bars=means, *p<0.05, ****p<0.0001. cSCC, cutaneous squamous cell carcinoma; TCM, T-cell central memory; TEM, T-cell effector memory; TEMRA, T-cell effector memory re-expressing CD45RA.

