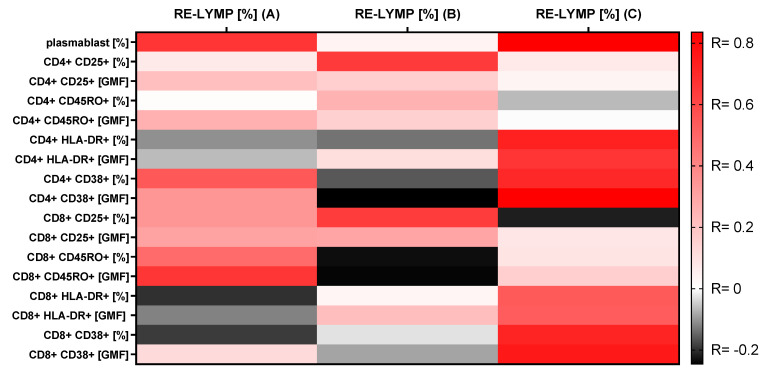
Figure 2.
A heatmap of Spearman correlation coefficients for the RE-LYMP parameter with activation lymphocytes markers using multiparameter flow cytometry in the 3 groups. A. with positive COVID-19 test, B. control group (HC), C. group with other virus infections with negative COVID-19 test. Correlations with an absolute value more than 0.5 are associated with p < 0.05, red—positive correlations, black—negative correlations.

