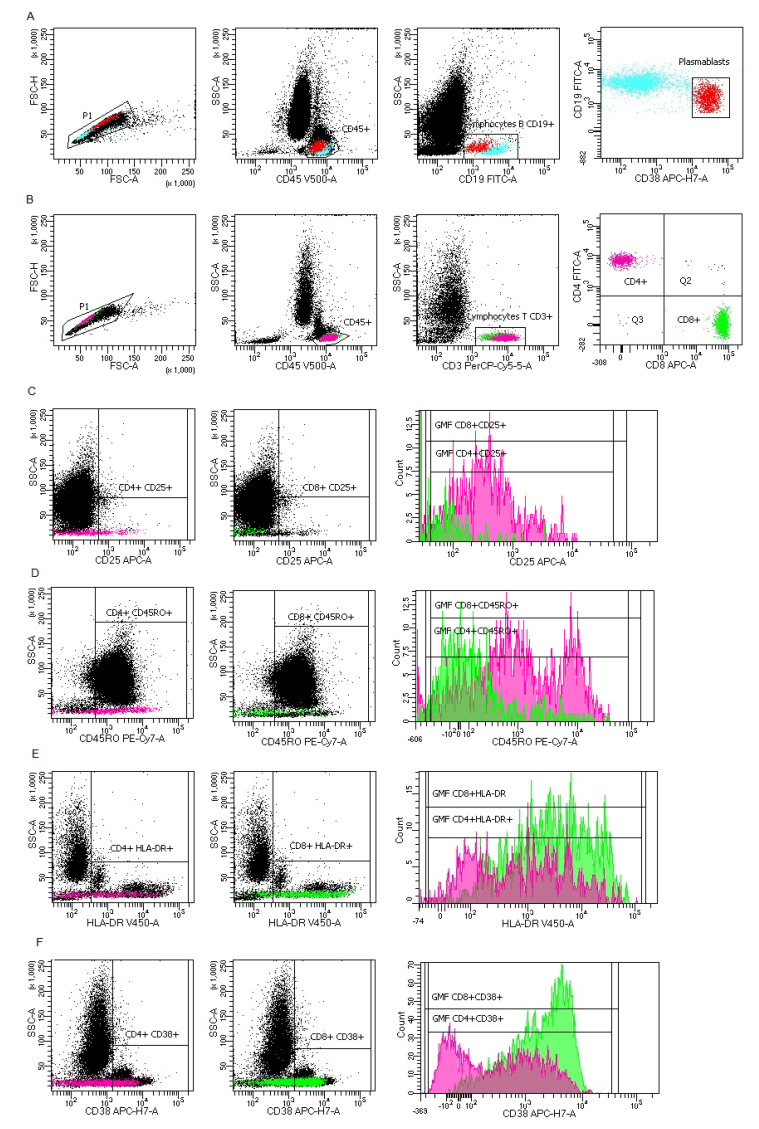
Figure A2.
Representative FACS analysis of PB cells with antibodies specific for plasmablasts and T cells (CD4+ and CD8+) with CD25, CD45RO, CD38 or HLA-DR expression. (A) Plasmablast gating strategy: FSC-A vs. FSC-H plot: Gating the cells that have an equal area and height, thus removing clumps (greater FSC-A relative to FSC-H) and debris (very low FSC), CD45 vs. SSC-A plot: Selection of lymphocytes based on their SSC/CD45+ properties, CD19 vs. SSC-A plot: Selection of lymphocytes B (blue) based on their SSC/CD19+ properties, CD19 vs. CD38 plot: Selection of plasmablasts (red) based on their CD19/CD38 properties (CD19+ and CD38+high). (B) T lymphocyte gating strategy: FSC-A vs. FSC-H plot: Gating the cells that have an equal area and height, thus removing clumps (greater FSC-A relative to FSC-H) and debris (very low FSC), CD45 vs. SSC-A plot: Selection of lymphocytes based on their SSC/CD45+ properties, CD3 vs. SSC-A plot: Selection of lymphocytes T based on their SSC/CD3+ properties, CD8 vs. CD4 plot: Selection of T lymphocyte subpopulation: CD4+ (pink) and CD8+ (green) based on their CD4/CD8 properties. (C) Representative plots with CD25 proportion and CD25 geometric mean fluorescence (GMF) intensity on CD4+ and CD8+ T lymphocyte subpopulation. (D) Representative plots with CD45RO proportion and CD45RO GMF intensity on CD4+ and CD8+ T lymphocyte subpopulation. (E) Representative plots with HLA-DR proportion and HLA-DR GMF intensity on CD4+ and CD8+ T lymphocyte subpopulation. (F) Representative plots with CD38 proportion and CD38 GMF intensity on CD4+ and CD8+ T lymphocyte subpopulation.

