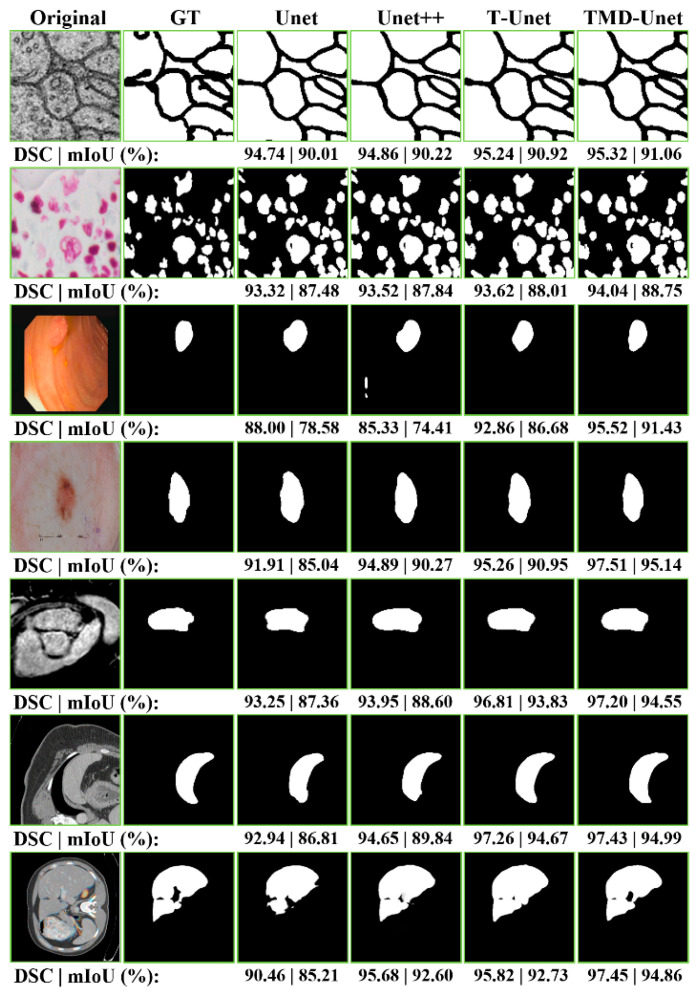
Figure 6.
The examples of the segmentation results on the testing images of the dataset. The first column shows the original images while the second column indicates the ground truth (GT). From the third to the seventh column are the accomplished results by Unet, Unet++, T-Unet, and TMD-Unet, respectively. The segmented applications are listed in top-to-bottom rows: EM, nuclei, polyp, left atrium, skin lesion, spleen, and liver, respectively.

