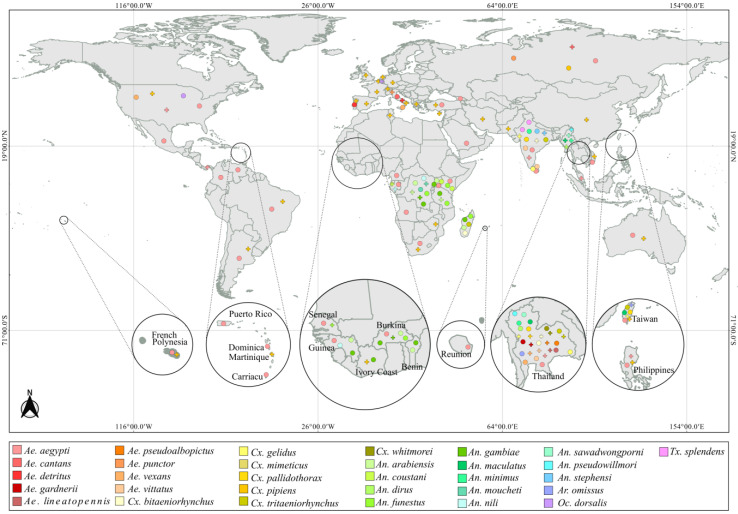
Figure 3.
World map showing the species sampling site per country that had variable Wolbachia infection rate. Crosses and circles represent sites where the species were positive and negative, respectively. The full interactive map can be accessed at https://microreact.org/project/rxDRQdWjzg86eXCTF8oNn4.

