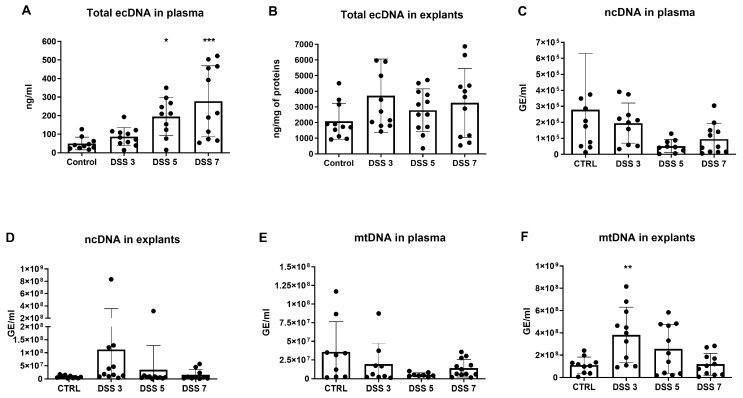
Figure 1.
Total, nuclear and mitochondrial DNA in plasma and colon explants. (A) the concentration of total ecDNA in plasma showed a time-dependent trend and was highest in DSS 7 group. (B) total extracellular DNA (ecDNA) in explants rose on day 3, however was lower in other timepoints. (C) the concentration of nuclear (ncDNA) in plasma did not differ between the groups. (D) ncDNA in explants reached the highest amount on day 3 and subsequently decreased until the end of the experiment. (E) mitochondrial (mtDNA) in plasma did not differ between the groups. (F) mtDNA in explants showed a similar pattern compared to ncDNA in explants, where mtDNA concentration rose on day 3 and decreased in other timepoints. * = p < 0.05; ** = 0.05 > p > 0.01; *** = p < 0.001.

