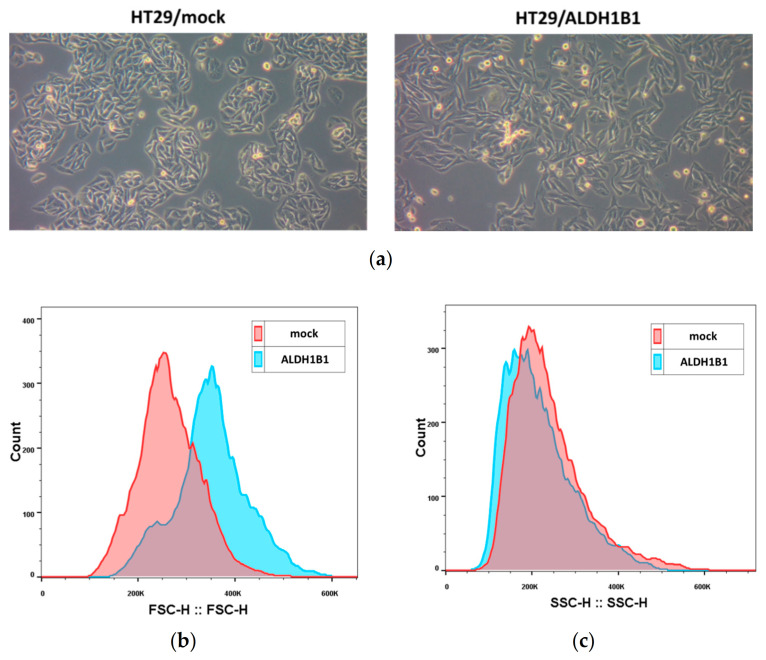
Figure 2.
Expression of ALDH1B1 triggers significant morphological alterations in HT29 cells. (a) Photographs of the HT29 isogenic cell line pair demonstrating the morphological differences under optical microscopy (magnification 20×). ALDH1B1-overexpressing cells have different sizes (b) and granularity (c) compared to mock control cells. At least 20,000 events were analyzed through flow cytometry, and the median fluorescence intensity of forward scatter (FCS) and side scatter (SSC) parameters was determined in both cell lines (Table 2). Representative histograms of FSC (b) and SSC (c) of the HT29 isogenic cell line pair. The HT29/ALDH1B1 histogram (light blue color) had appreciably right-shifted forward and left-shifted side scatter, demonstrating the bigger size and lower granularity of ALDH1B1-overexpressing cells in comparison to HT29/mock cells (pink color). Graphs are representative of three independent experiments performed under each experimental condition.

