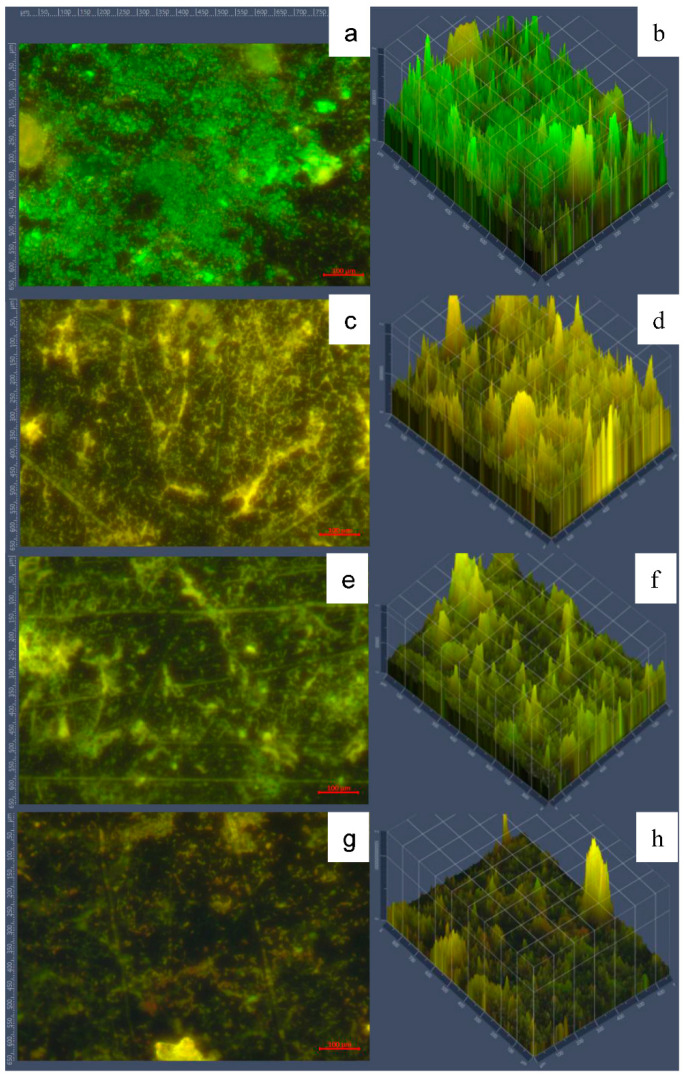
Figure 8.
Micrographs of SSP with biofilms on type A deposits. Panels (a,b) show 5-day biofilms. Panels (c,d) show the cleaning stage of 50 mg NaOH/L of AEW at 30 °C for 10 min, only. Panels (e), f show disinfection using 50 mg/L total available chlorine of NEW at 20 °C for 5 min, only. Panel (g,h) show cleaning followed by disinfection stages. Green fluorescence indicates viable cells, while red fluorescence indicates damaged cells. Panels (a,c,e,g) show 40X magnification; panels (b,d,f,h) show fluorescence intensity.

