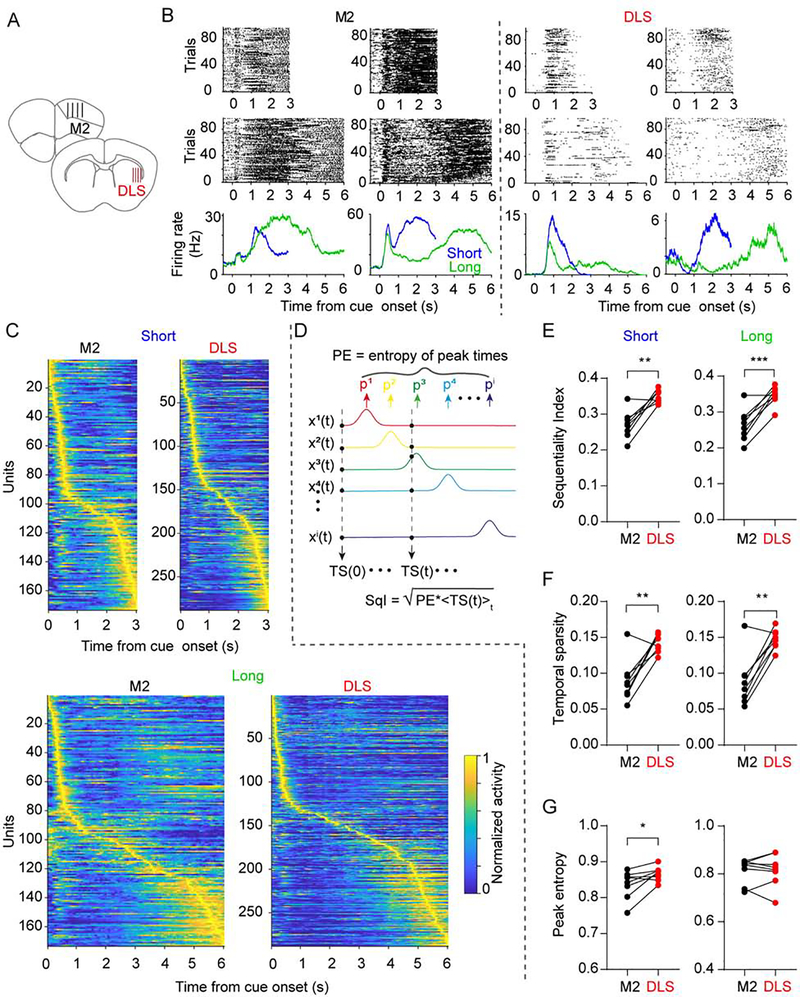
Figure 2. Higher sequentiality indices in DLS compared to M2.
(A) Illustration of the silicon microprobe recording site locations in M2 and DLS.
(B) Spiking raster plot for two example units for short (top) and long (middle) intervals with corresponding average firing rate (bottom) in M2 (left) and DLS (right).
(C) Simultaneously recorded population activity from one animal in M2 and the DLS for the short (top) and long (bottom) interval. Each row represents the firing rate of one unit normalized by its maximum rate. Units were ordered by their latency to maximum firing rate in each area independently (See also Figure S1). Temporal sparsity is reflected in the off-diagonal regions.
(D) The sequentiality index (SqI) was calculated from the entropy of the peak response times (PE) across all units multiplied by the temporal sparsity (TS).
(E) The SqI in DLS was significantly higher than in M2 for both time intervals (n = 8 mice; two-sided paired t-test, t7 = 5.157, P = 0.001 and t7 = 5.855, P = 0.0006 for the short and long intervals, respectively).
(F) The temporal sparsity in DLS was significantly higher than that in M2 for both time intervals (n = 8 mice; two-sided paired t test, t7 = 4.486, P = 0.003 and t7 = 5.299, P = 0.001 for the short and long interval, respectively).
(G) The peak entropy in DLS was slightly higher than that in M2 for the short interval but not significant different for the long interval.(n = 8 mice; two-sided paired t test, t7 = 2.780, P = 0.027 and t7 = 0.107, P = 0.918 for the short and long interval, respectively).

