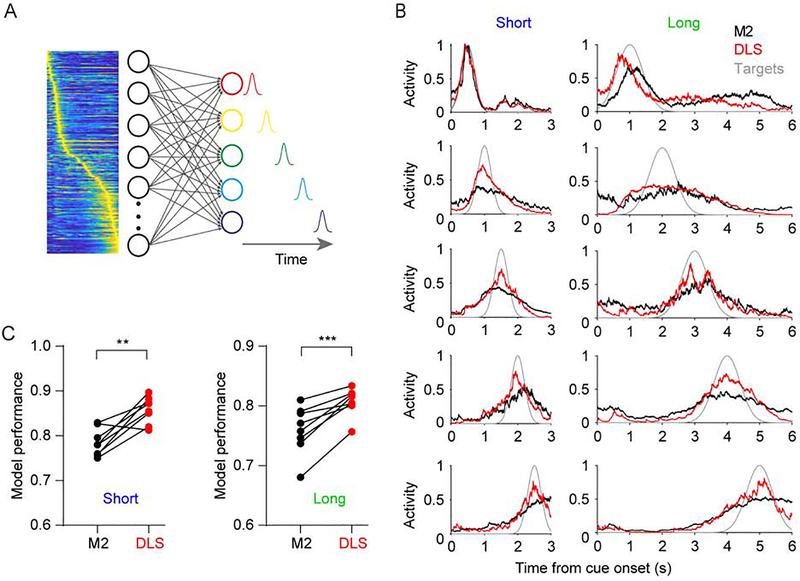
Figure 3. DLS dynamics with higher sequentiality are better at generating timed responses.
(A) Illustration of the model used to quantify how well downstream networks can read out time from different dynamical regimes. The five outputs units were trained to generate responses at five different evenly spaced time intervals using a non-negative weight constrained least square model.
(B) Responses of the five output units trained to decode the experimentally observed dynamics in M2 (black) or DLS (red). The model was run separately for the short (left) and long (right) interval. Target functions are shown in grey.
(C) Performance of the artificial downstream network as measured by the average correlation coefficient between the generated and target trajectories was significantly higher in DLS for both time intervals (n = 8 mice; two-sided paired t test, t7 = 4.565, P = 0.0026 and t7 = 6.027, P = 0.0005 for the short and long interval, respectively) (See also Figures S2–S4).

