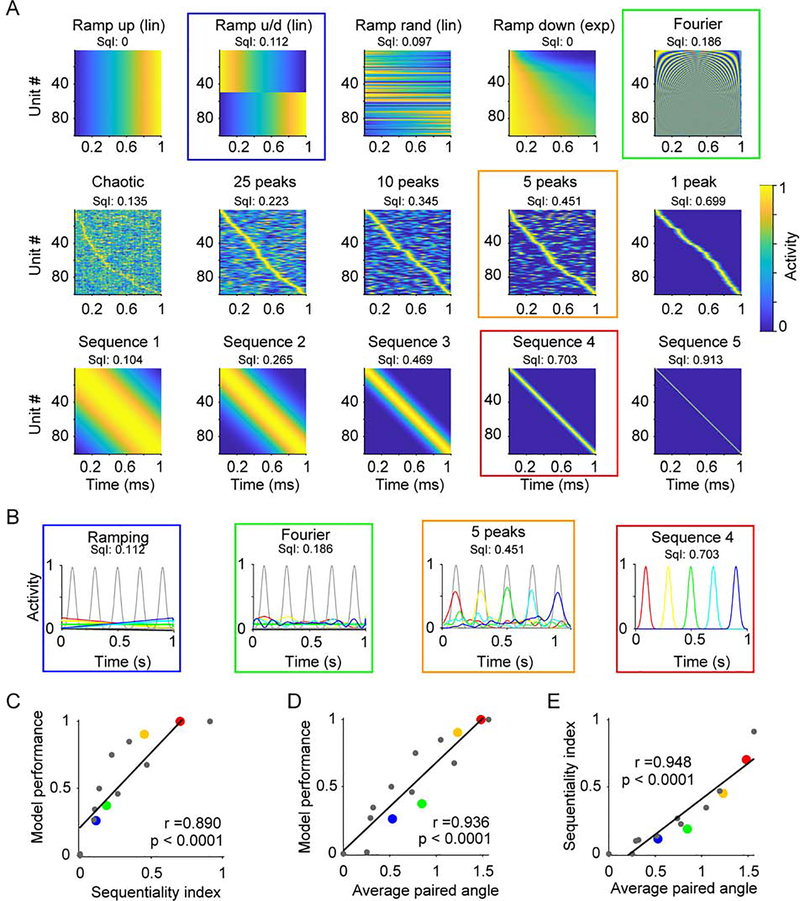
Figure 4. Neural sequences provide a set of near orthogonal basis functions to read out time.
(A) Prototypical examples of different dynamical regimes that can encode time. Examples are based on a number of experimentally observed dynamical regimes, e.g. linear (lin) or exponential (exp) ramping, and a high-dimensional periodic regime (“Fourier”). The corresponding sequentiality index (SqI) is displayed on top. Colored squares emphasize the dynamics used in panels B and corresponding dots in panel C, D and E.
(B) The trajectories (color coded as in Figure 3A) generated by 4 activity patterns from (A) denoted by the corresponding color coded square, and the target functions (grey).
(C) The SqI is significantly correlated with the performance of the output units (n = 15 simulated data sets, Pearson correlation coefficient r = 0.890, P < 0.0001). Black line represents the best linear fit.
(D) Average of the angles between all xi pairs correlates with model performance (correlation coefficient r = 0.936, P < 0.0001). Note that for the sequence 4 dynamics outlined in red (corresponding to the red dots in panels C, and E) the average angle is 1.47 in radians, corresponding to a near orthogonal 84 degrees.

