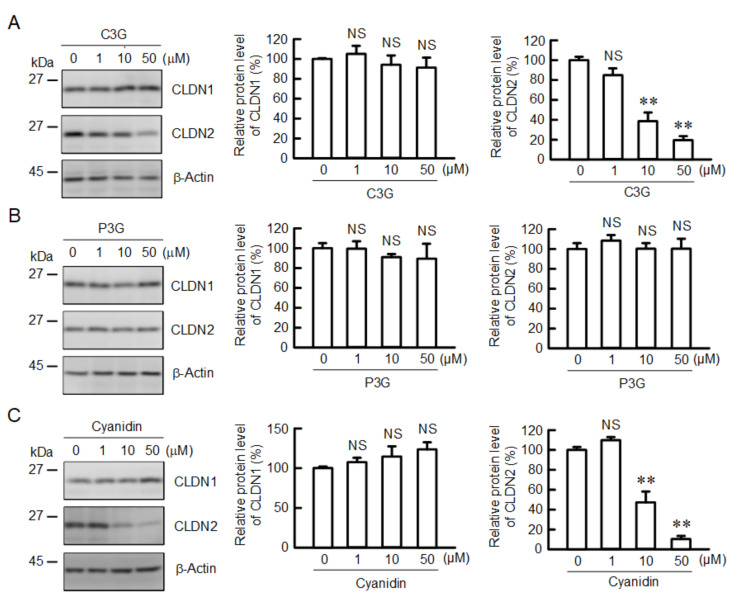
Figure 1.
Effects of anthocyanins on the protein levels of CLDN1 and CLDN2 in A549 cells. Cells were incubated with 0, 1, 10, or 50 µM C3G (A), P3G (B), or cyanidin (C) for 24 h. Cell lysates were immunoblotted with anti-CLDN1, anti-CLDN2, and anti-β-actin antibodies. The protein levels of CLDN1 and CLDN2 are represented as a percentage relative to 0 µM. n = 3–4. ** p < 0.01 and NS p > 0.05 compared with 0 µM.

