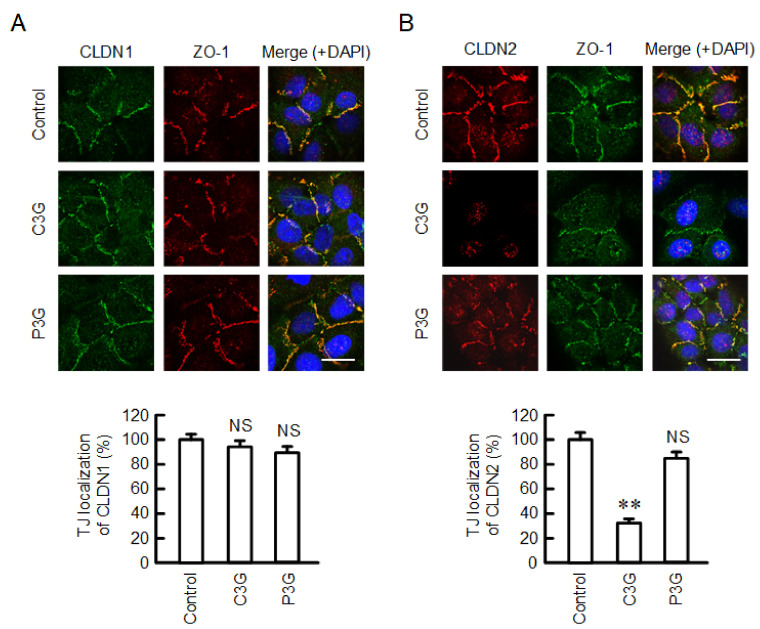
Figure 2.
Effects of anthocyanins on the cellular localization of CLDN1 and CLDN2. Cells cultured on cover glasses were incubated in the absence (control) and presence of 50 µM C3G or P3G for 24 h. (A) The cells were stained with anti-CLDN1 (green), anti-ZO-1 (red), and nuclear marker DAPI (blue). (B) The cells were stained with anti-CLDN2 (red), anti-ZO-1 (green), and DAPI (blue). Merged images are shown in the right panel. The scale bar represents 10 µm. The TJ localizations of CLDN1 and CLDN2 are shown as percentage of control (n = 132-220 cells). ** p < 0.01 and NS p > 0.05 compared with control.

