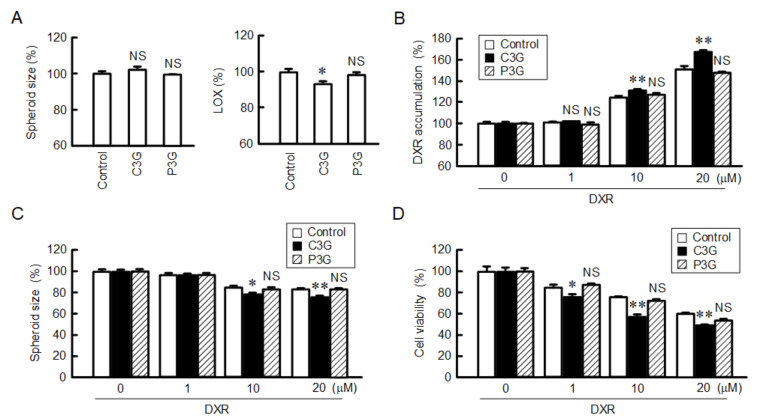
Figure 10.
Increase in DXR-induced toxicity by C3G in spheroid cells. Cells cultured on PrimeSurface 96U multi-well plates were treated with 0 µM (control) and 50 µM anthocyanins for 24 h. (A) The spheroid size and fluorescence intensity of LOX-1 are represented as a percentage relative to control. (B) After treatment with anthocyanins, the cells were incubated with DXR at the indicated concentrations for 1 h. The accumulation of DXR is represented as a percentage relative to 0 µM DXR. (C,D) The cells were incubated with DXR at the indicated concentrations for 24 h. The spheroid size and cell viability are represented as a percentage relative to 0 µM DXR. n = 4–6. ** p < 0.01, * p < 0.05, and NS p > 0.05 compared with control.

