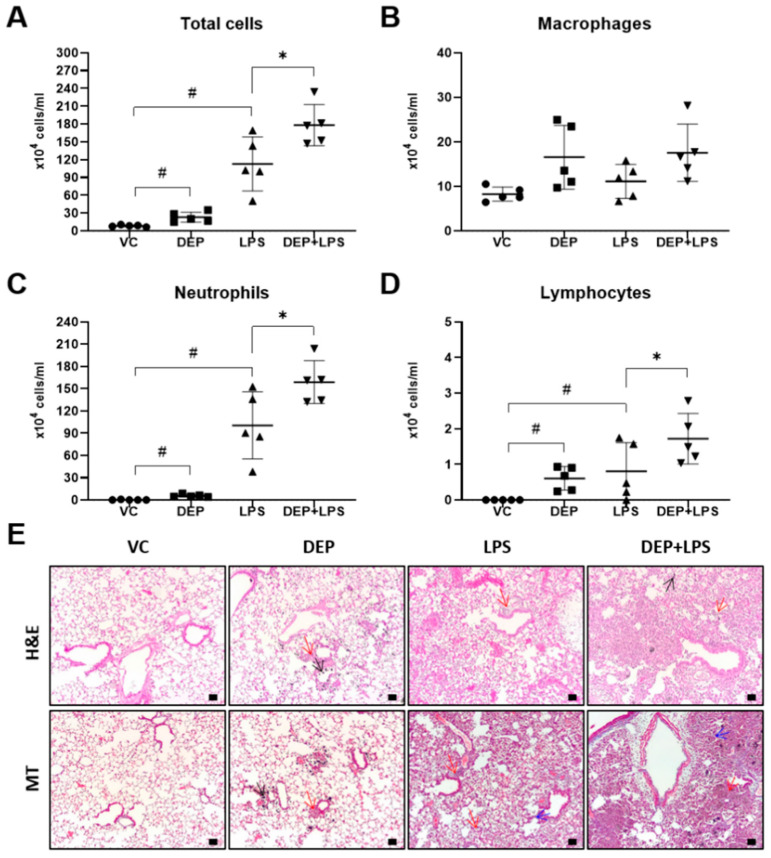
Figure 3.
(A–D) Cellular changes in the bronchoalveolar lavage (BAL) fluid and (E) representative hematoxylin and eosin (H&E) and Masson’s trichrome-stained images of the lung sections from the vehicle control (VC), DEP, LPS, and DEP pre-exposed and LPS-instilled (DEP + LPS) groups. Black, red, and blue arrows indicate particle-pigmented alveolar macrophages, inflammatory infiltration, and collagen deposition, respectively. Scale bars = 50 μm. Data represent means ± SD (n = 5 per group). # p < 0.05 vs. VC, * p < 0.05 vs. LPS group.

