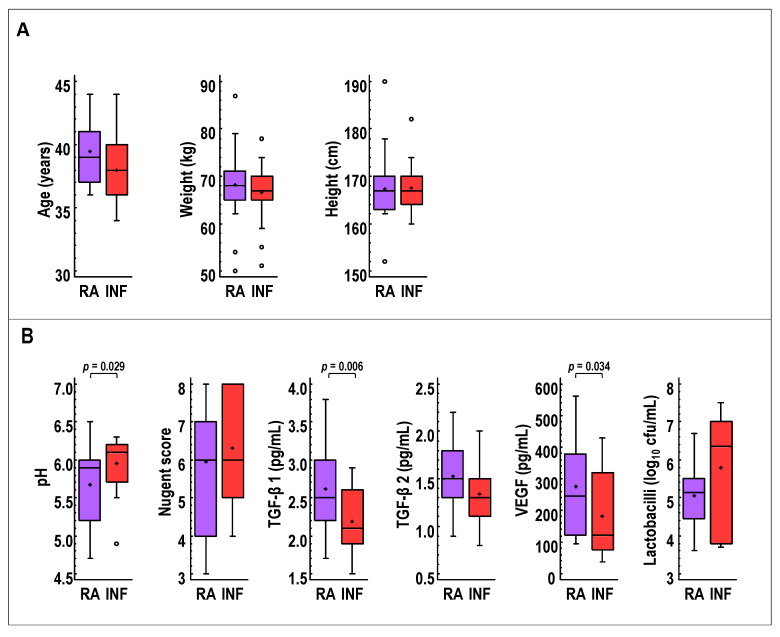
Figure 2.
Comparison of selected baseline (A) demographic characteristics (age, weight and height) and (B) vaginal parameters (pH, Nugent score, TGF-β 1, TGF-β 2, and VEGF concentrations, and viable Lactobacillus counts) in CVL samples of women with repetitive abortion (RA, purple) and women with infertility of unknown origin (INF, red) at recruitment. For each boxplot, the line and the cross within the box represent the median and mean, respectively. The bottom and top boundaries of each box indicate the first and third quartiles (the 25th and 75th percentiles), respectively. The whiskers represent the lowest and highest values within the 1.5 interquartile range (IQR) and the dots outside the rectangles are suspected outliers (>1.5 × IQR). One-way ANOVA tests were used to compare both groups.

