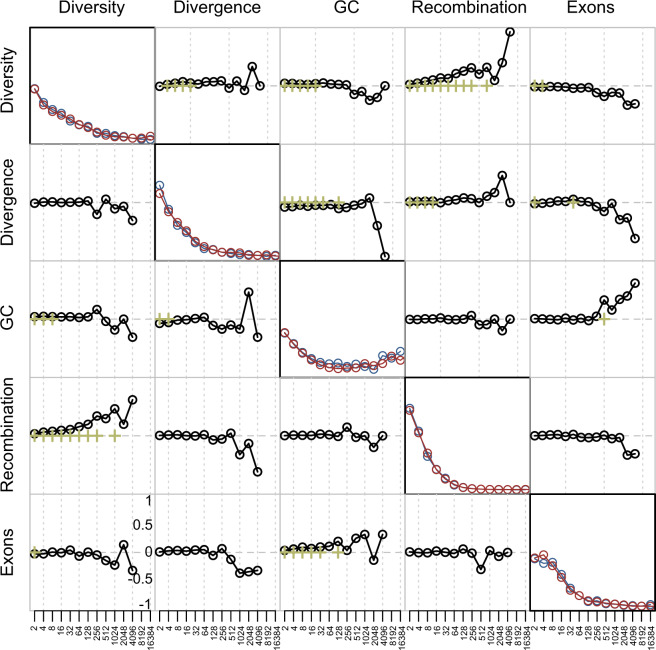
Fig. 3.
Power spectra and pairwise correlations of detail coefficients. The power spectrum of the wavelet decomposition (i.e., a summary of the total variance in the signal due to heterogeneity at distinct scales) of each genomic feature on the short (blue) and long (red) arms of chromosome 8 is depicted along the diagonal. Pairwise correlations between detail coefficients (calculated using Kendall's rank correlation) are depicted in the off-diagonal plots (bottom left: short arm; top right: long arm; green crosses highlight correlations significant at the 1% level in a two-tailed test). Signals are provided at increasingly broader kilobase scales.

