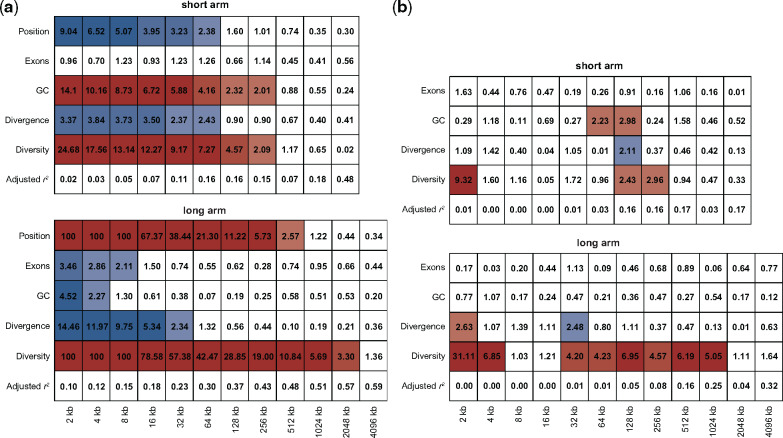
Fig. 4.
Genomic features associated with recombination rate. Marginal significance for the linear model analysis of the (a) smoothed and (b) detail coefficients using diversity, divergence, GC-content, and exon content as predictors of recombination. Colors indicate significant linear relationships (red: positive; blue: negative; with color intensity being proportional to the level of significance using a two-sided t-test to determine −log10P-values). Adjusted r2 indicate the proportion of variance in the signal that can be explained by the model.

