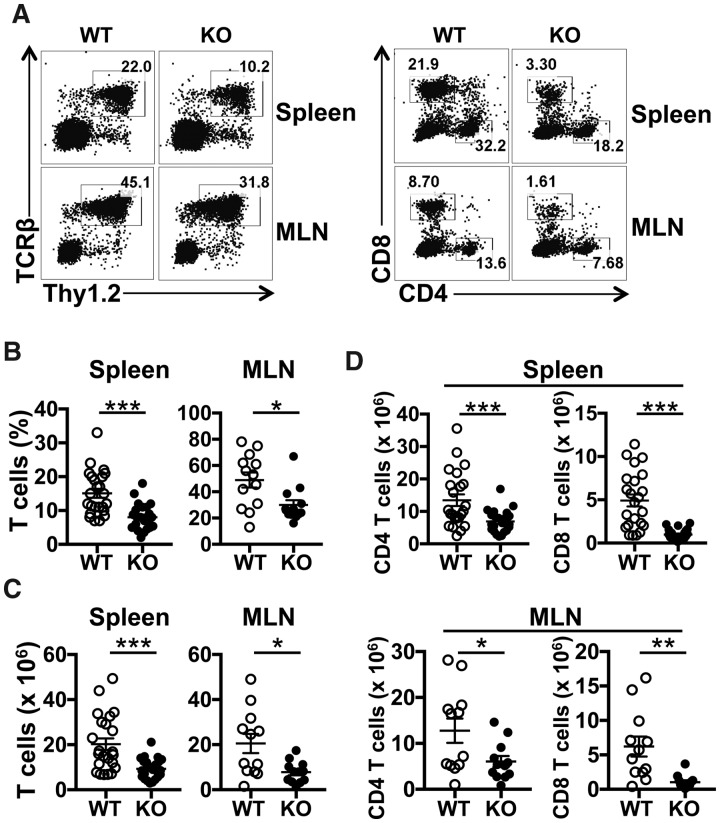
Fig. 2.
T cell conditional deletion of Srsf1 in mice leads to lymphopenia
Spleen and MLN cells from WT and Srsf1-ko mice were stained with fluorescent antibodies and analysed by flow cytometry. (A) Plots show Thy1.2+ TCRβ+ T cells (left panel) and CD4+ and CD8+ T cells (right panel) gated on live cells. (B) Graphs show the percentage of T cells (spleen: n = 24 each, MLN: n = 13 each, mice <20 weeks old). (C) Graphs show absolute number of T cells (spleen: n = 23 each, MLN: n = 12 each, mice <20 weeks old). (D) Graphs show absolute numbers of CD4 and CD8 T cells (spleen: n = 23 each, MLNs: n = 12 each, mice <20 weeks old) (unpaired t test, *P < 0.05, **P < 0.005, ***P < 0.0005).

