Fig. 3.
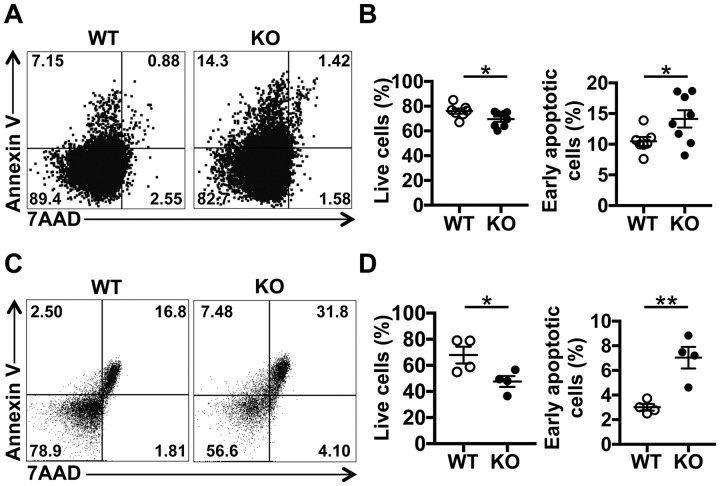
T cell conditional deletion of Srsf1 in mice leads to increased apoptosis
Spleen cells were isolated from WT and Srsf1-ko mice, stained with fluorescent antibodies and analysed by flow cytometry. (A) Plots show 7AAD and Annexin V expression on ex vivo gated T cells. (B) Graph shows the percentage of live cells and early apoptotic cells (7AAD−Annexin V+) (WT, n = 7; ko, n = 8). (C) Spleen cells were stimulated with anti-CD3 (2 μg/ml) and anti-CD28 (2 μg/ml) antibodies for 48 h. Flow cytometry plots show 7AAD and Annexin V expression on T cells. (D) Graph shows the percentage of live cells and early apoptotic cells (7AAD−Annexin V+) (n = 4) (unpaired t test, *P < 0.05, **P < 0.005).

