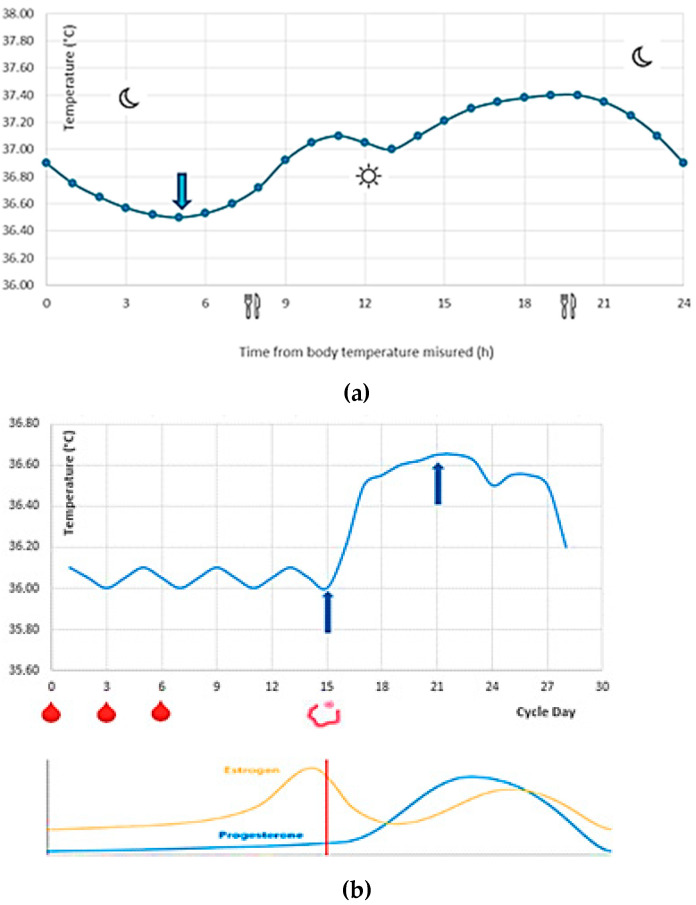
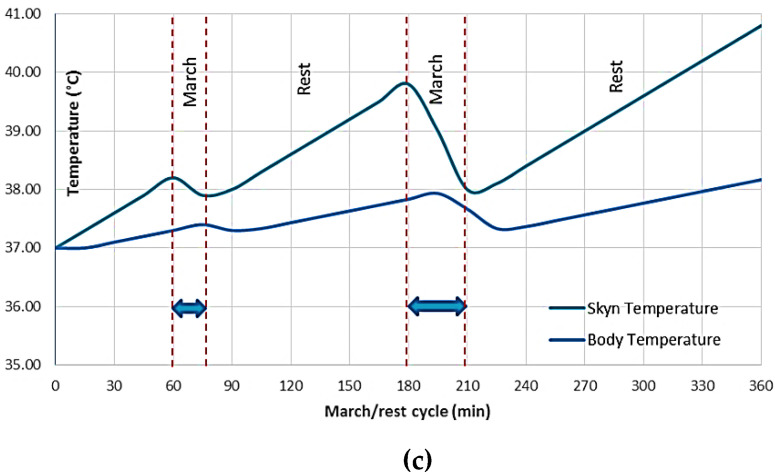
Figure 4.
Typical body temperature trend: (a) circadian rhythm (the blue arrows represent respectively the minimum and the maximum peak during the day); (b) ovulatory cycle and hormonal concentration (the blue arrows represent the minimum and the maximum peak during the month, and the red drops represent the menstruation); (c) march/rest cycle (the metabolism due to muscle activity, in particular the blue arrows represent the march cycle and the remaining one the rest cycle).


