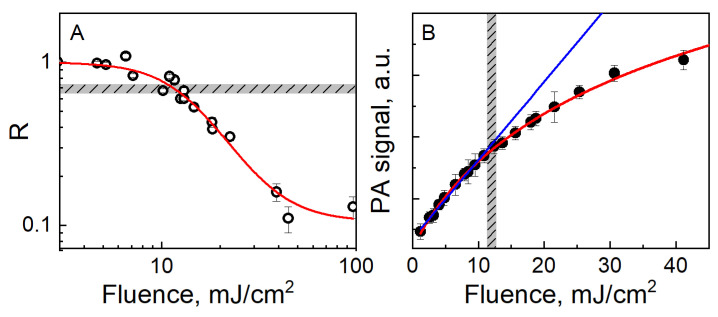
Figure 5.
Methods to analyze the photoinstability of gold nanorods. (A): Typical sigmoid trend of the parameter labelled as R (see the main text for a definition) vs. excitation fluence. (B): Representative example for the occurrence of a sublinear trend of photoacoustic (PA) signal vs. excitation fluence, denoting the onset of reshaping.

