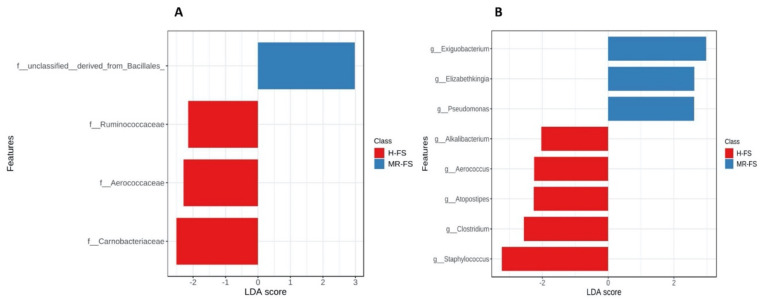
Figure 6.
Linear discriminant analysis (LDA) effect size (LEfSe) at the family (A) and genus (B) taxonomic level. The horizontal bars represent the effect size for each taxon. The length of the bar represents the log10-transformed LDA score, indicated by vertical dotted lines. The red bars represented the significant OTUs of the H-FS group and the blue bars of the MR-FS group.

