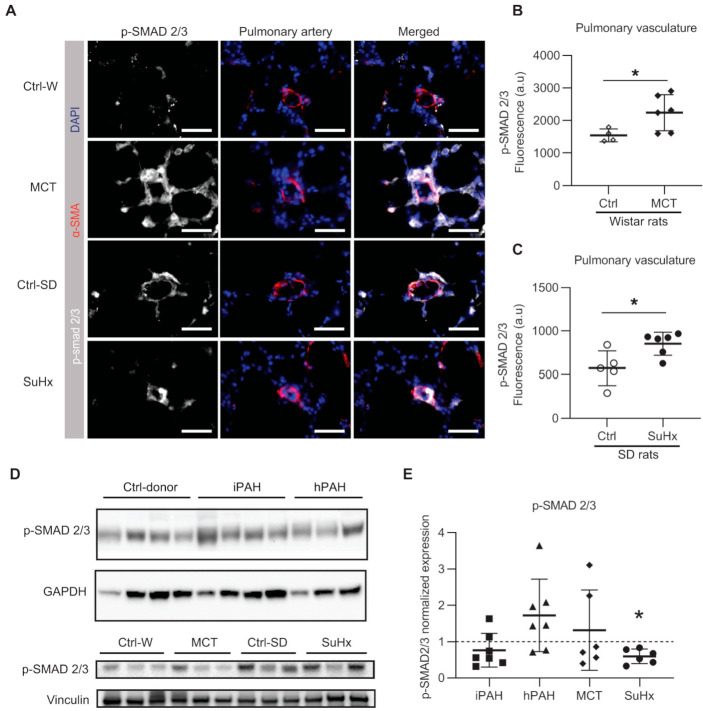
Figure 5.
The phosphorylation of SMAD2/3 in human PAH and animal models of PAH: (A) representative immunofluorescent images; white = pSMAD2/3; red = α-SMA; blue = nuclei. Scale bar = 50 μm; (B) quantified data of pSMAD2/3 expression within the area co-stained with α-SMA in MCT rats. Wistar rats: n(ctrl) = 4, n(MCT) = 6; (C) quantified data of pSMAD2/3 expression within the area co-stained with α-SMA in SuHx rats. SD rats: n(ctrl) = 5, n(SuHx) = 6; (D) representative images of Western blot analysis in whole lung lysates. (E) The quantification data of phospho-SMAD (pSMAD) 2/3 expression normalized to vinculin. n(iPAH) = 7, n(hPAH) = 7, n(MCT) = 6, n(SuHx) = 6. iPAH: idiopathic pulmonary arterial hypertension, hPAH: hereditary pulmonary arterial hypertension, Ctrl: control, MCT: monocrotaline rats, SuHx: sugen–hypoxia rats. * p < 0.05.

