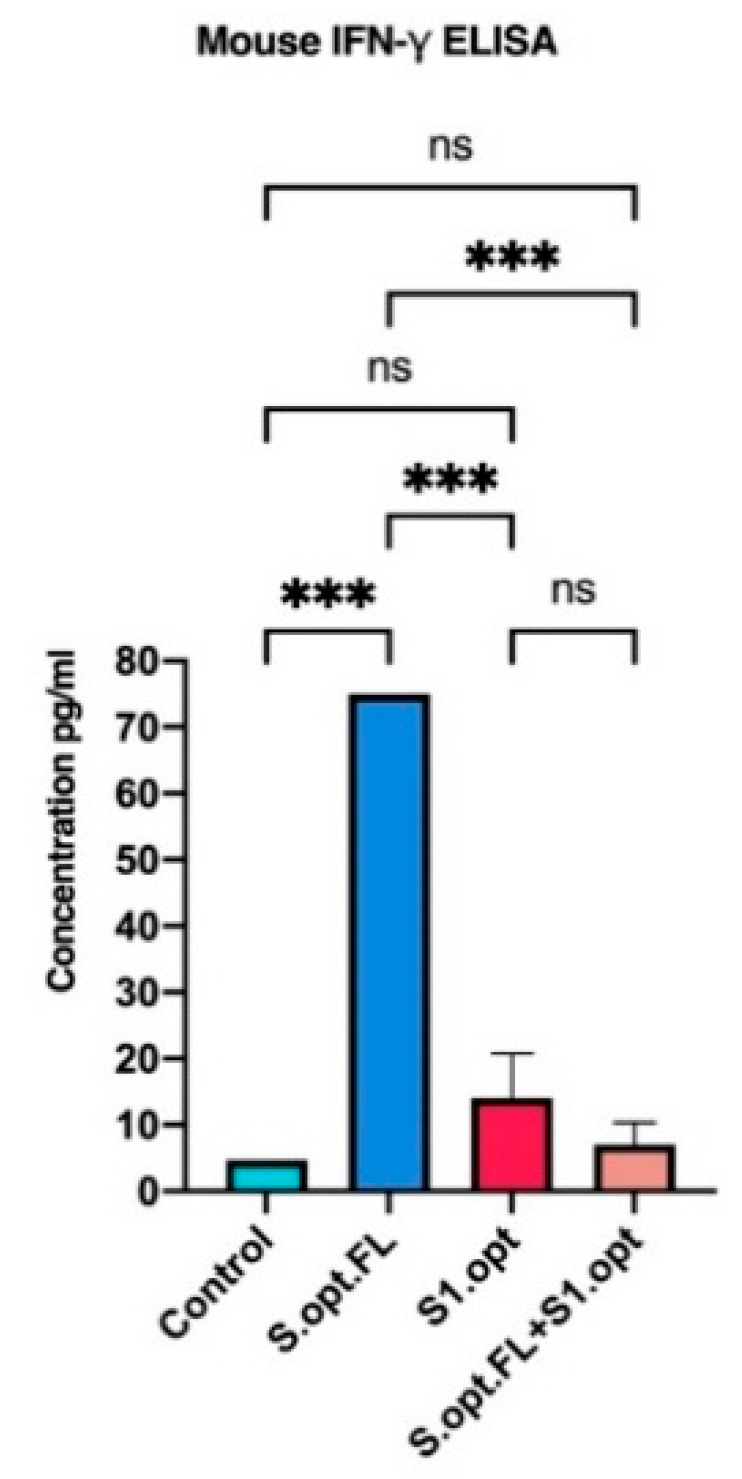
Figure 6.

In vivo IFN-γ responses following C57BL/6 mice vaccinations. Comparing serum IFN-γ levels in each of vaccine constructs (S.opt.FL, S1.opt, and S.opt.FL+S1.opt) 2 weeks following second immunization in each vaccine construct using pooled mice sera from each group. Endpoint concentration was determined by titers expressed (mean ± SD). Data were analyzed with one-way ANOVA with Tukey’s multiple comparison test. The asterisks refer to the level of significance: *** p < 0.0002; ns: no significant difference.
