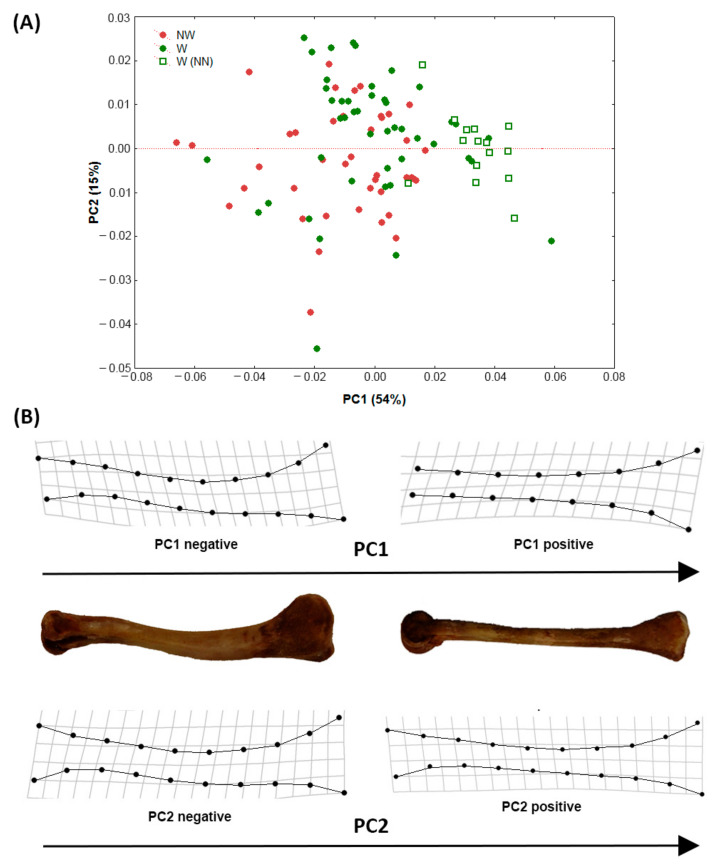
Figure 2.
(A) Principal component analysis plot. Grouping variable: Walking (W)/not-walking (NW)/walking naked neck (W-NN). (B) Shape variation along PC1 and PC2 was represented by splines relative to positive and negative extremes of the axes. For shape variation along PC1, tibiae of two extreme individuals were reported.

