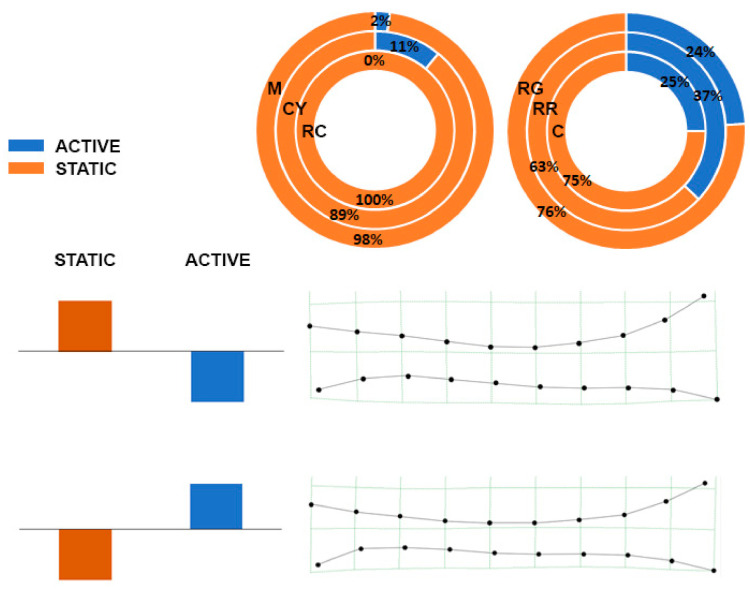
Figure 4.
Partial least squares (PLS) showing the morphological relationship between the tibia and the walking/resting behavior described as percentage of time spent in two main activities (Walking W and Not Walking—NW). Percentages for each genotype are represented in pie charts. The splines depict tibia shape configuration corresponding to opposite patterns of behavior.

