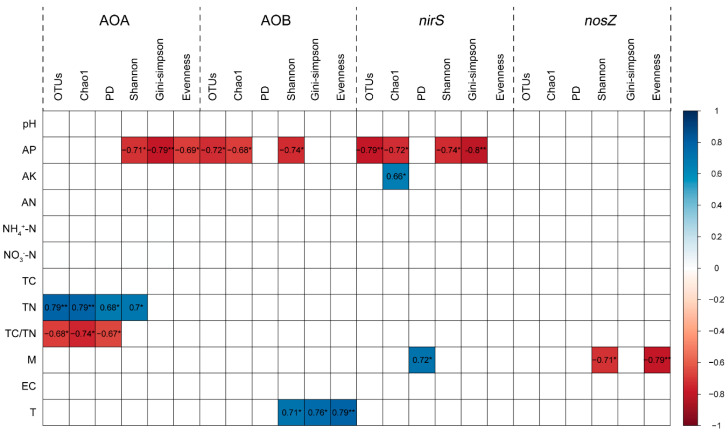
Figure 3.
Pearson correlations between alpha diversity indices of functional genes and soil physicochemical properties. AP: available P; AK: available K; AN: alkaline N; NH4+-N: ammonium-N; NO3−-N: nitrate-N; TC: total C; TN: total N; M: soil moisture; EC: soil electrical conductivity; T: soil temperature. OTUs: observed number of OTUs; Chao1: Chao1 richness index; PD: phylogenetic diversity index; Shannon: Shannon diversity index; Gini–Simpson: Gini–Simpson index; Evenness: Shannon’s evenness index. Cell entries are Pearson correlation coefficients (r) between two indices. Only significant correlations are shown. * p < 0.05, ** p < 0.01.

