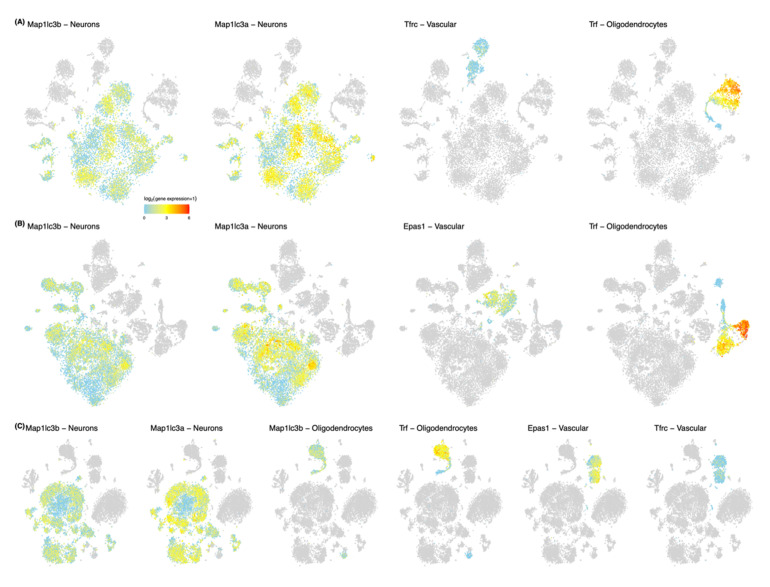
Figure 3.
Ferroptosis gene expressions in the cortices of the adolescent mouse brain. Distributions of FR genes were described for various cell types in the mouse brain. Cell types, including neurons, oligodendrocytes, or other non-neuronal cells are described as a cluster of cells using the t-distributed stochastic neighbor embedding (t-SNE), a probabilistic method for visualizing high dimensional single cell RNA-sequencing data. Among FR genes that are converted to mouse genes, five genes (Epas1, Map1lc3a, Map1lc3b, Tfrc, Trf) with postnatal rising trajectory were used. Only clusters with markers that intersected with FR genes are colored, according to the expression levels, which are log2 transformed. Clusters that are not of interest in each plot are colored in light gray. (A) t-SNE plot in anterior cortex; (B) middle cortex; (C) posterior cortex.

