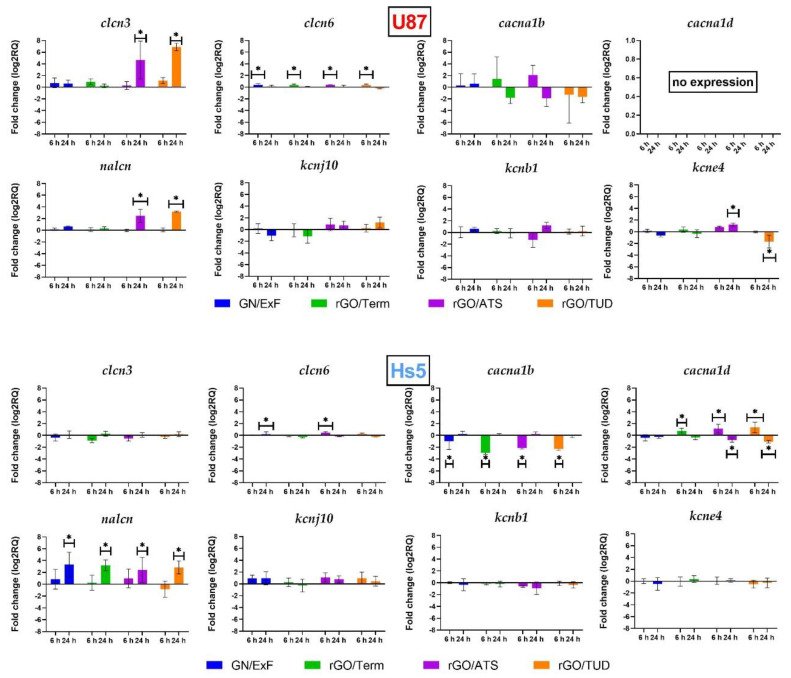
Figure 4.
Analysis of the mRNA expression level of voltage-gated ion channels after treatment at 25 µg/mL concentration for 6 and 24 h in U87 and Hs5 cells. The results are calculated relative to the control values. Log2RQ (log2 relative quantitation) values for all genes are normalized to the RPL13A housekeeping gene. Statistical significance between the control and the treated cells is indicated by an asterisk and was assessed using Bonferroni’s multiple comparisons test. Differences with p-value < 0.05 were considered significant. One asterisk (*) means p-value < 0.05. Abbreviations: rGO, reduced graphene oxide; GN, graphene; C, control group (untreated group); ExF, exfoliation; Term, thermal; ATS, ammonium thiosulphate; TUD, thiourea dioxide; clcn3, chloride voltage-gated channel 3; clcn6, chloride voltage-gated channel 6; cacna1b, calcium voltage-gated channel subunit alpha1 B; cacna1d, calcium voltage-gated channel subunit alpha1 D; nalcn, sodium leak channel, non-selective; kcnj10, potassium inwardly rectifying channel subfamily J member 10; kcnb1, potassium voltage-gated Channel subfamily B member 1; kcne4, potassium voltage-gated channel subfamily E regulatory subunit 4; rpl13a, ribosomal protein L13a; log2RQ, log2 relative quantitation.

