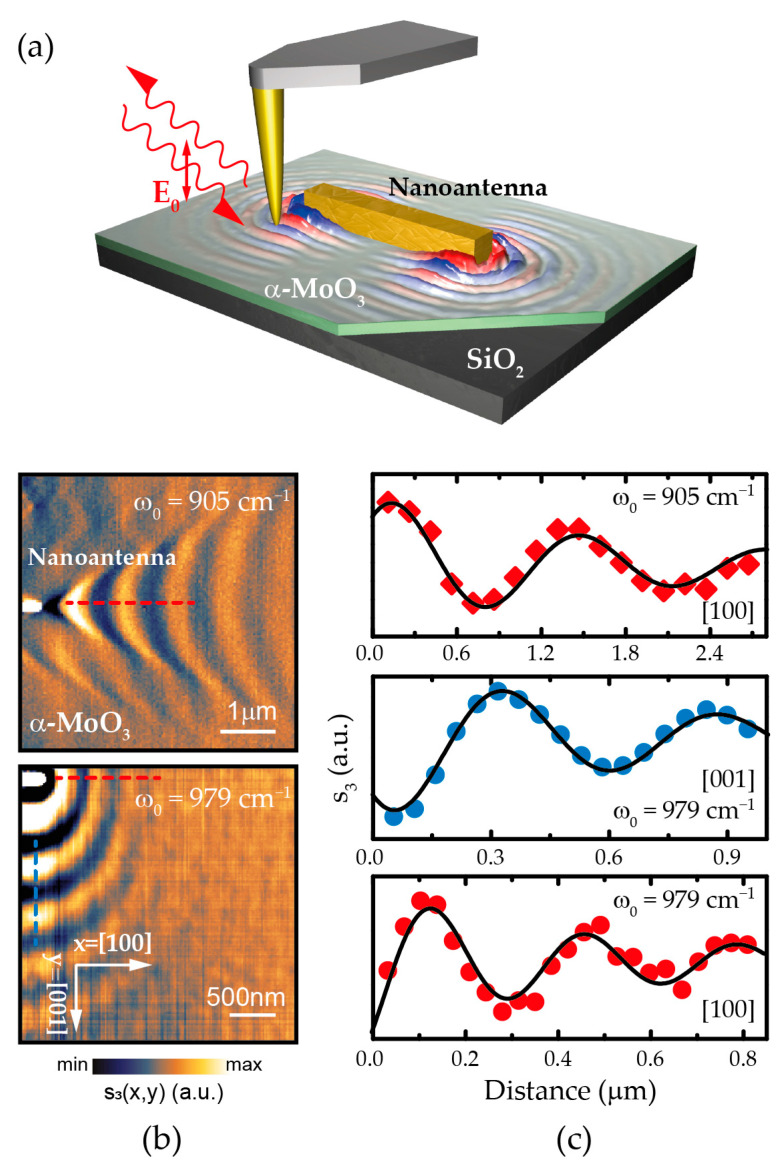
Figure 1.
(a) Schematics of the experimental setup employed to image propagating PhPs in a α-MoO3 flake transferred on a SiO2 substrate. A gold rod-like nanoantenna is used to confine the incident infrared light with p-polarized field E0, which allows the excitation of PhPs. The near-field signal on the surface of the slab is scattered by a metallic tip and detected by a distant detector. (b) Experimental near-field amplitude images (s3(x,y)) launched by the nanoantenna in a 225-nm-thick (see Appendix A) α-MoO3 flake at illuminating frequencies ω0 = 905 cm−1 (hyperbolic regime, top panel) and ω0 = 979 cm−1 (elliptic regime, bottom panel). (c) Experimental profiles (dots) taken along the [100] and [001] directions denoted by dashed lines in (b). The fit to the experimental data is depicted with a black solid line.

